Purpose
These analyses show percent complete information broken down by date.
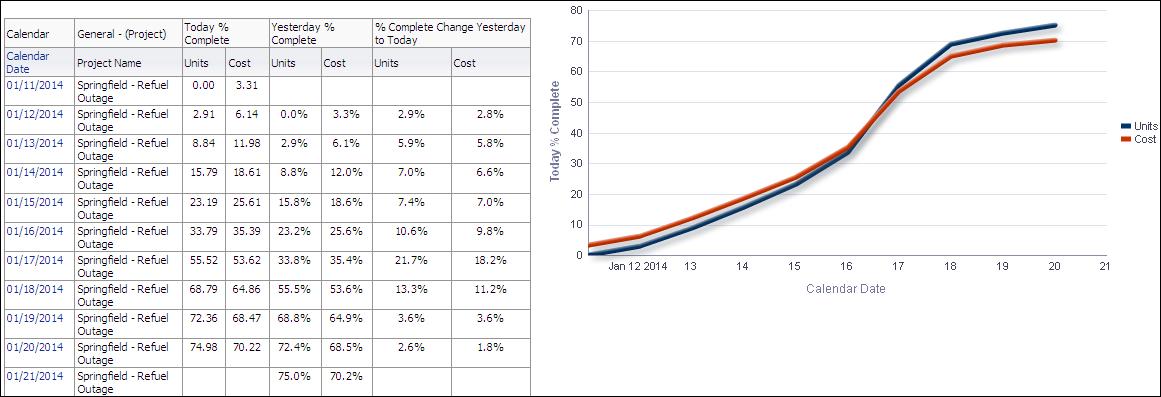
The table breaks down data by date and shows columns for:
- Calendar Date
- Project Name
- Units (Today % Complete)
- Cost (Today % Complete)
- Units (Yesterday % Complete)
- Cost (Yesterday % Complete)
- Units (% Complete Change Yesterday to Today)
- Cost (% Complete Change Yesterday to Today)
The line chart shows the Today Percent Complete from the start of project until the given day of analysis. There are lines for Units and Cost.
The x-axis shows the Calendar Date. The y-axis shows the Today Percent Complete on the given day from start. Hover over a point for specific information.
Location
- On the Home page, click Dashboards.
- Under Primavera, select Project Health.
- On the Project Health dashboard, click the History page.
- On the History page, expand the % Complete History section.
Subject Area
Project History