Purpose
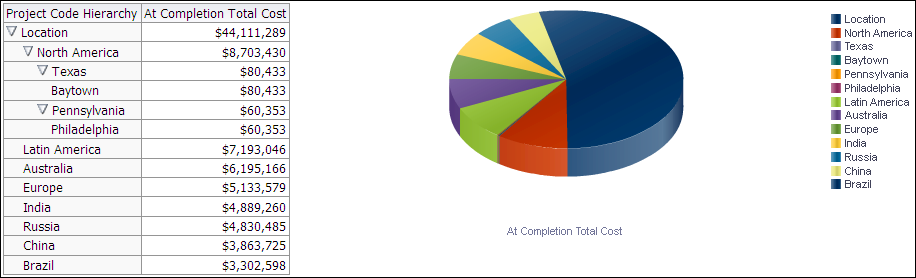
The pivot table breaks down At Completion Total Cost by project code value. Click expand/collapse next to a value to drill down into the hierarchy.
The pie chart reflects the data shown in the pivot table and will change with the table.
The pie chart shows the At Completion Total Cost broken down by country. The segments represent the amount of At Completion Total Cost accountable to each location shown. The pie chart will update based on the displayed hierarchies in the pivot table.
Location
- On the Home page, click Dashboards.
- Under Primavera, select Project Health.
- On the Project Health dashboard, click the Location page.
- On the Location page, expand the Project Code Hierarchy section.
Subject Area
Activity