Purpose
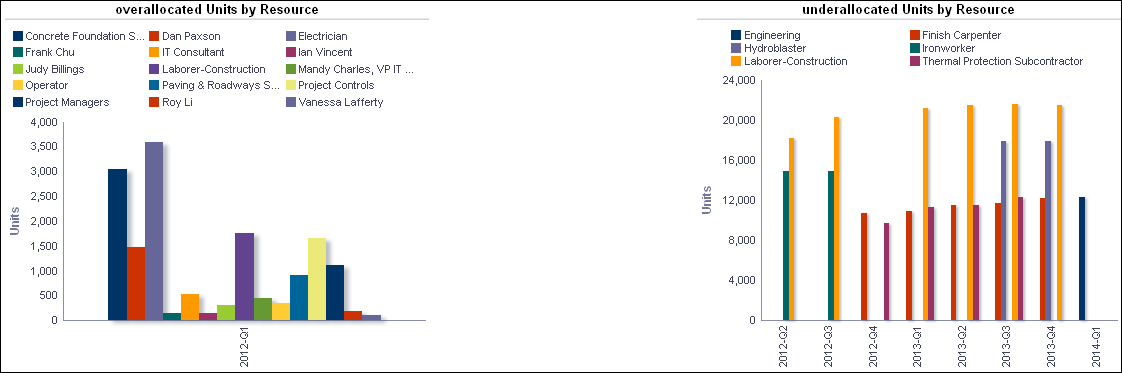
The analysis shows Overallocated Units By Resource and Underallocated Units By Resource bar charts.
The Overallocated Units By Resource bar chart shows overallocation bars for each resource broken down by year and quarter. If no resource is overallocated in a quarter, that quarter will not appear in the chart.
The x-axis shows the year and the quarter. The y-axis shows overallocated Units. Hover over a bar for specific information about that bar.
The Underallocated Units By Resource bar chart shows underallocation bars for each resource broken down by year and quarter. If no resource is under allocated in a quarter, then that quarter will not appear in the chart.
The x-axis shows the year and the quarter. The y-axis shows underallocation Units. Hover over a bar for specific information about that bar.
Location
- On the Home page, click Dashboards.
- Under Primavera, select Resource Analysis.
- On the Resource Analysis dashboard, click the Overview page.
- On the Overview page, expand the Over/Under Allocation section.
Subject Area
Resource Utilization