Purpose
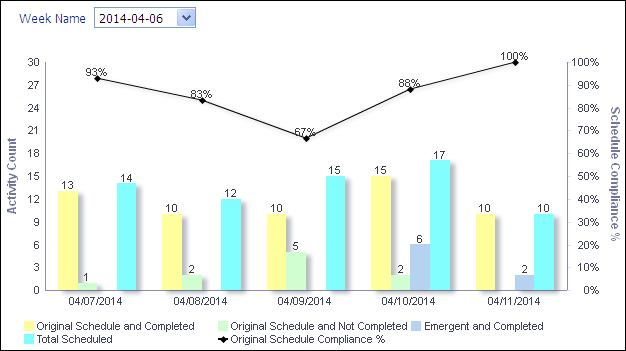
The bar-line chart shows scheduled compliance for the selected week. Original Schedule Compliance percentage measures the number of activities which were completed against the number which were scheduled to complete. The line-bar chart shows:
- Bars for Original Schedule and Completed, Original Schedule and Not Completed, Emergent and Completed, and Total Scheduled
- A line for Original Schedule Compliance Percentage
The x-axis shows dates. The y-axis for the bars, on the left, is the Activity Count. The y-axis for the line, on the right, is Schedule Compliance Percentage.
Select the week to view from the Week Name list. Click on a bar or point to show the data in table form.
Location
- On the Home page, click Dashboards.
- Under Primavera, select Industry Standards.
- On the Industry Standards dashboard, click the Routine/On-Line Maintenance page.
- On the Routine/On-Line Maintenance page, expand the Schedule Compliance section.
Subject Area
Burn Down