Purpose
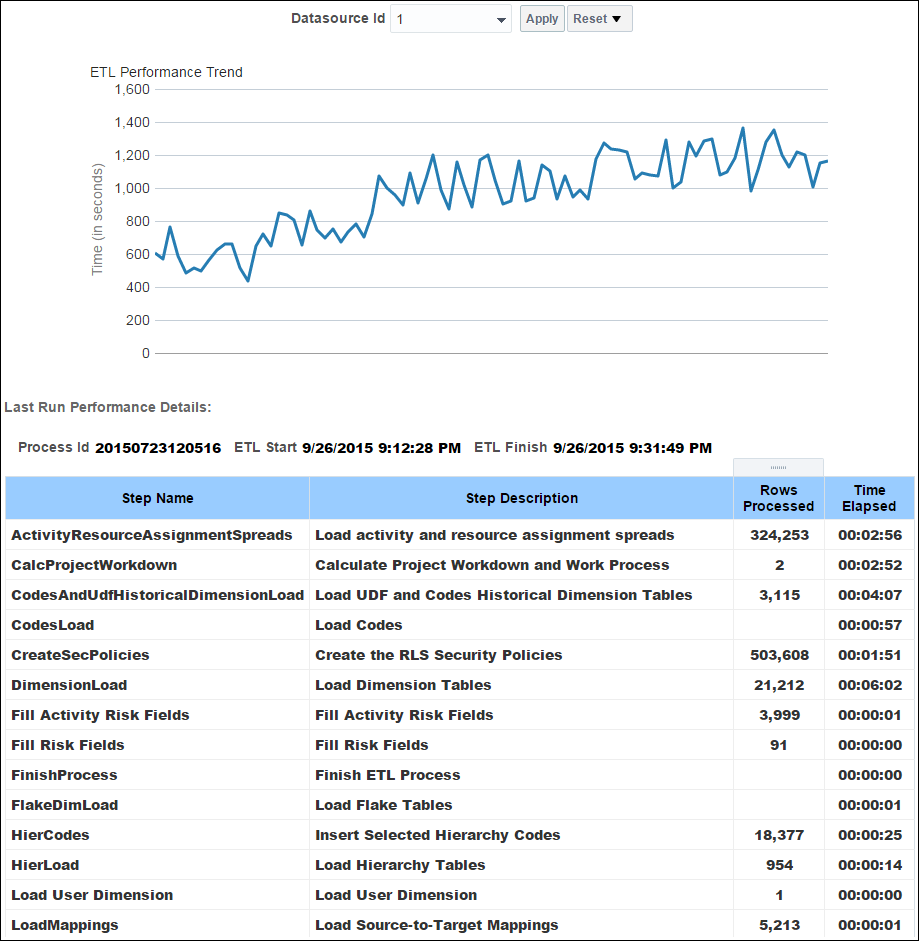
The line chart shows the trend of ETL run times for the data source selected in the Datasource Id list.
The table shows details for each step of the last ETL run. The Process Id and ETL Start and Finish times are shown above the table. The table contains columns for:
- Step Name
- Step Description
- Rows Processed
- Time Elapsed
Location
- On the Home page, click Dashboards.
- Under Primavera, select Admin.
- On the Admin dashboard, click the Admin page.
- On the Admin page, expand the ETL Performance section.
Subject Area
Admin