Purpose
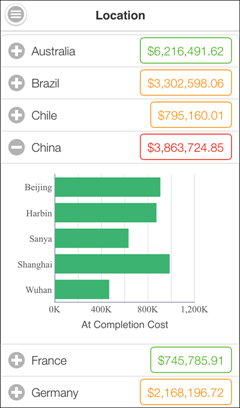
The accordion navigation page displays At Completion Total Cost by country name. Clicking on a country shows a bar chart of the At Completion Total Cost by city name for the selected country. The stoplight conditional formatting is based on a comparison of At Completion Total Cost vs. Planned Total cost (< 98% = Red, 98-100% = Yellow, > 100% = Green).
Location Drill
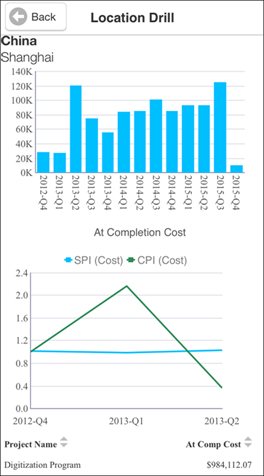
The bar chart shows At Completion Total Cost by quarter, for all projects in the city selected from the bar chart on the Location page.
The line chart shows the SPI(Cost) and CPI(Cost) by quarter, for all projects in the city selected from the bar chart on the Location page.
The table lists all projects in the city selected from the bar chart on the Location page.
The table contains columns for:
- Project Name
- At Completion Total Cost
Location
- From the My Apps page, tap Phone Apps.
- Tap Executive Dashboard - Phone (Light).
- Tap
 Table of Contents.
 - Tap Location.
Subject Area
Activity