
Purpose
The tile navigation contains a line chart that shows At Completion Total Cost by quarter, repeated for each country name. The stoplight conditional formatting is based on a comparison of At Completion Total Cost vs. Planned Total cost (< 98% = Red, 98-100% = Yellow, > 100% = Green).
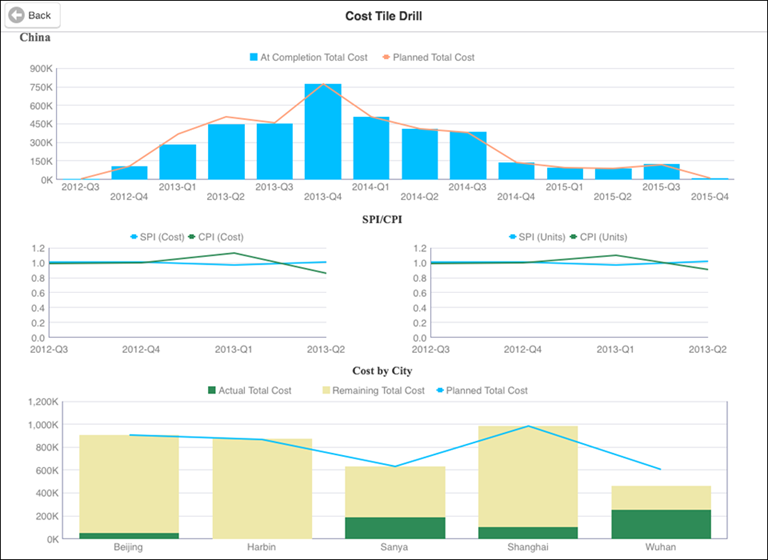
Cost Tile Drill
The bar-line combination chart shows At Completion Total Cost as a bar and Planned Total Cost as a line by quarter, for all projects in the country selected from the Location: Cost Tiles Page
SPI/CPI
This section shows, for all projects in the country selected from the Location: Cost Tiles Page:
- A line chart which plots the SPI(Cost) and CPI(Cost) by quarter.
- A line chart which plots the SPI(Units) and CPI(Units) by quarter.
Cost by City
The stacked bar-line combination chart shows Actual Total Cost and Remaining Total Cost as stacked bar and Planned Total Cost as a line by city name, for all projects in the country selected from the Location: Cost Tiles Page
Location
- From the My Apps page, tap Tablet Apps.
- Tap Executive Dashboard - Tablet (Light).
- Tap
 Table of Contents.
 - Tap Location: Cost Tiles.
Subject Area
Activity