Purpose
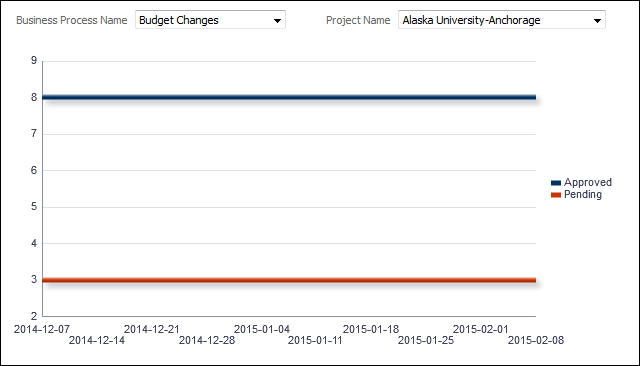
The line chart shows weekly record counts for the selected Business Process and Project. It contains two lines: One for Approved business processes; the other for Pending business processes.
The x-axis shows weeks. The y-axis shows counts.
Location
- On the Home page, click Dashboards.
- Under Primavera, select Business Processes.
- On the Business Processes dashboard, click the History page.
- On the History page, expand the Weekly Business Process Trend by Project and Count section.
Subject Area
Business Process History