Purpose
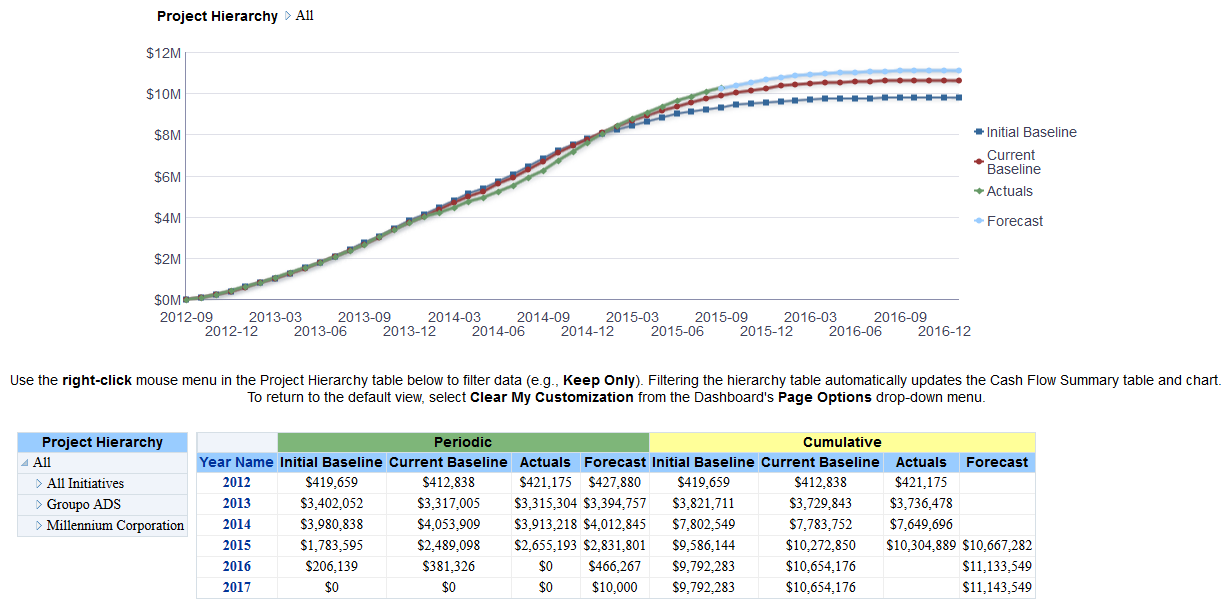
The line graph shows lines for:
- Initial Baseline (Cumulative)
- Current Baseline (Cumulative)
- Actuals (Cumulative)
- Forecast (Cumulative)
The x-axis shows months. The y-axis shows cash flow values.
The pivot table contains columns for:
- Year Name
- Periodic
- Initial Baseline
- Current Baseline
- Actuals
- Forecast
- Cumulative
- Initial Baseline
- Current Baseline
- Actuals
- Forecast
Right-click on Project Hierarchy elements in the Project Filter pivot table and select Keep Only to filter the contents of the pivot table and line graph.
Location
- On the Home page, click Dashboards.
- Under Primavera, select Cash Flow.
- On the Cash Flow dashboard, click the Overview page.
- On the Overview page, expand the Cash Flow Summary by Project section.
Subject Area
Cash Flow