Purpose
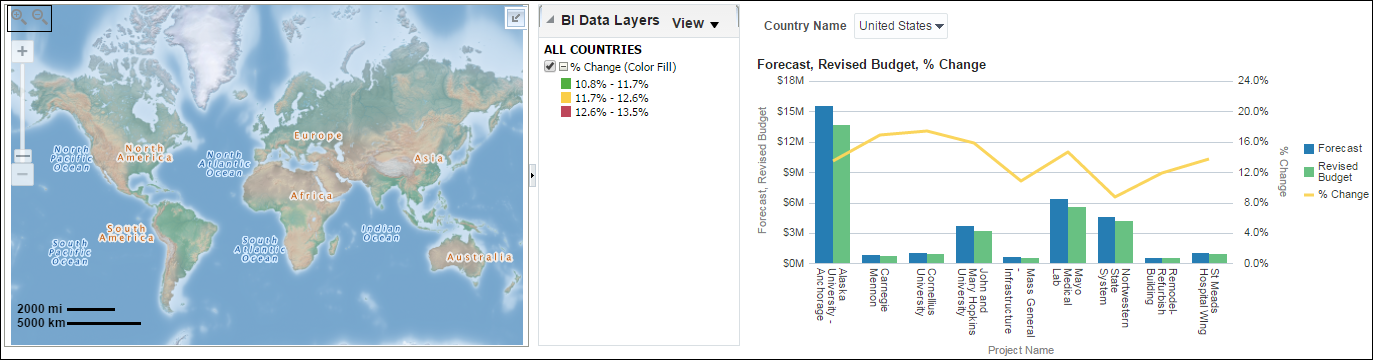
The map shows Revised Budget percentages by geographic location. Hover over a highlighted area to show details for that area. Use the control to zoom in details by state and city.
The line-bar chart shows bars for Forecast Budget and Revised Budget for projects in the selected country. The line represents the difference between Forecast Budget and Revised Budget shown as a percentage. The x-axis shows projects. The y-axis for the bars (left) shows cost sheet values. The y-axis for the line (right) shows percentages.
Location
- On the Home page, click Dashboards.
- Under Primavera, select Cost Sheet.
- On the Cost Sheet dashboard, click the Location page.
- On the Location page, expand the Revised Budget by Location section.
Subject Area
Cost Sheet