Purpose
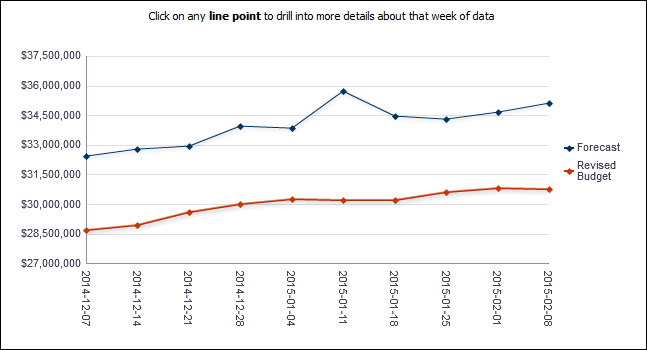
The line chart shows weekly cost sheet values for Forecast and Revised Budget.
The x-axis shows weeks. The y-axis shows values.
Location
- On the Home page, click Dashboards.
- Under Primavera, select Cost Sheet.
- On the Cost Sheet dashboard, click the History page.
- On the History page, expand the Revised Budget vs. Forecast Weekly Trend section.
Subject Area
Cost Sheet History