Purpose
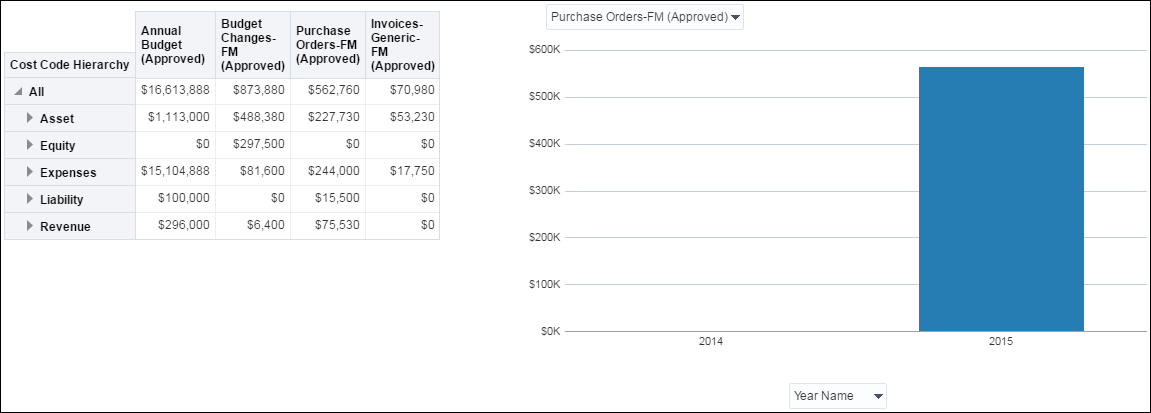
Depending on the selection, the bar graph on the right displays annual budget (approved), budget changes-FM (approved), purchase orders-FM (approved), or invoices-generic-FM (approved) details. Depending on the selection, the x-axis represents the year, quarter, or month name. The y-axis represents the cost.
The pivot table to the left displays the cost code hierarchy. You can view the hierarchy and break down of each cost code: asset, equity, expenses, liability, and revenue.
Location
- On the Home page, click Dashboards.
- Under Primavera, select Facilities and Real Estate.
- On the Facilities and Real Estate dashboard, click the Cost Sheet page.
- On the Cost Sheet page, expand the Cost Sheet section.
Subject Area
Cost Sheet