Purpose
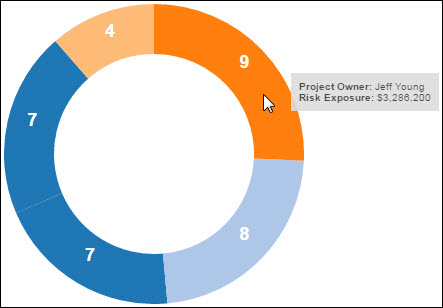
Use the donut chart to display risks broken down by project owner. Mouse over each section to view details about the risk's project owner and risk exposure.
Location
- On the Home page, click Dashboards.
- Under Primavera, select More.
- On the More dashboard, click the d3 page.
- On the d3 page, expand the Donut Chart - Risks by Project Owner section.
Subject Area
Activity