Purpose
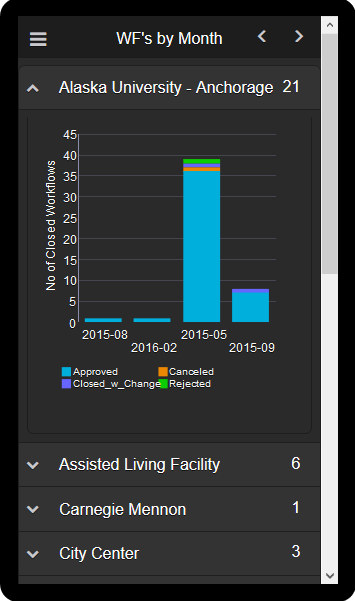
The chart shows completed workflows by month for each project name. The month is represented on the x-axis, and the number of closed workflows is represented on the y-axis. The chart legend indicates the number of closed workflows that were Rejected, Closed with Change, Canceled, and Approved. The project data represented in the chart can be selected in the Project Name menu.
Location
- From the My Apps page, tap Phone Apps.
- Tap Business Process Workflow- Phone.
- On the Cover Page, scroll to the right.
Subject Area
Business Process