Purpose
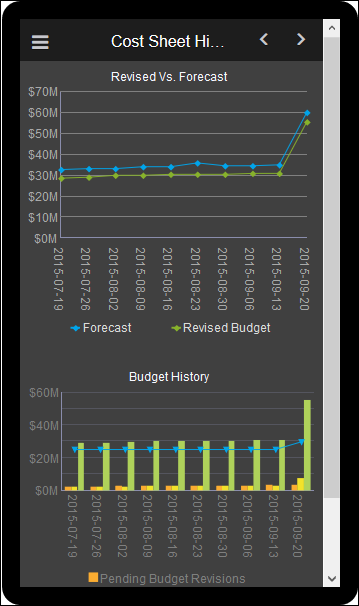
The line chart shows weekly cost sheet values for Forecast and Revised Budget.
The x-axis shows weeks. The y-axis shows values.
Location
- From the My Apps page, tap Phone Apps.
- Tap Cash Sheet History- Phone.
- On the Cover page, scroll to the right.
Subject Area
Cost Sheet History