Purpose
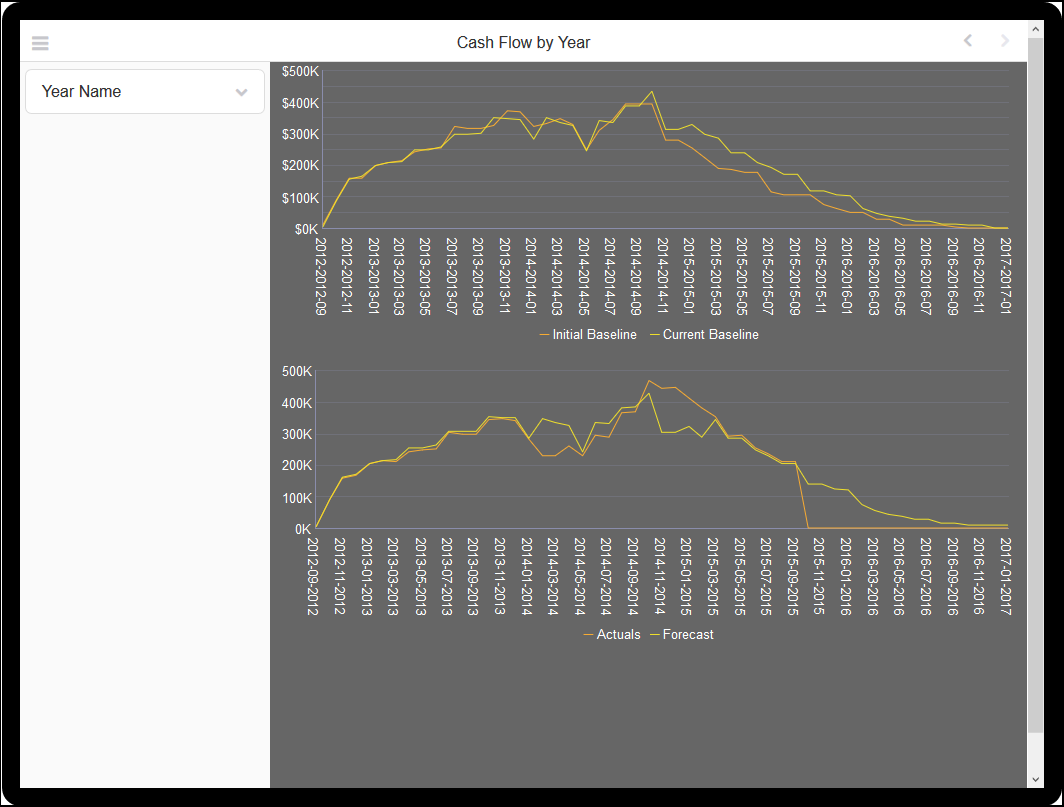
The line chart shows monthly Actuals and Forecast cash flow values.
The x-axis shows months. The y-axis shows values.
Subject Area
Cash Flow Summary
The line chart shows monthly Actuals and Forecast cash flow values.
The x-axis shows months. The y-axis shows values.
Cash Flow Summary
Legal Notices | Your Privacy Rights
Copyright © 2013, 2020
Last Published Monday, December 14, 2020