Purpose
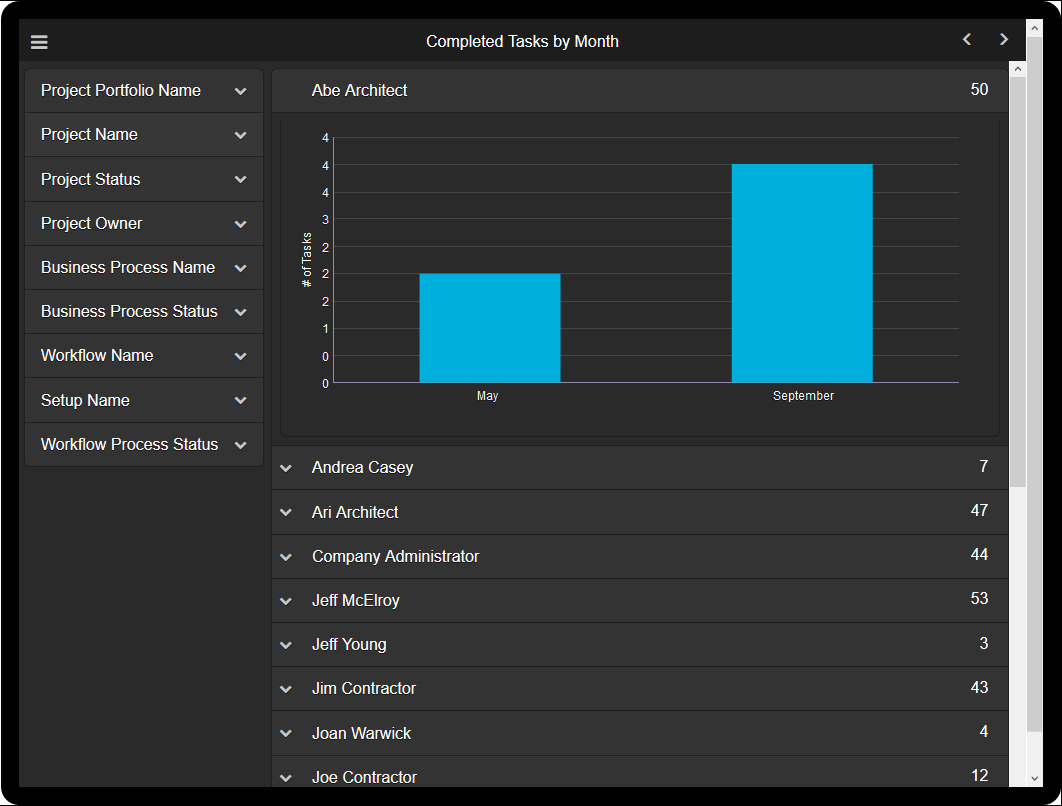
The chart shows completed BP workflows sorted by Project Name. The date is represented on the x-axis, and the number of closed workflows is represented on the y-axis. The chart legend indicates the number of closed workflows that are Rejected, Closed with Change, Cancelled, and Approved. The Project data represented in the chart can be selected in the Project Name menu.