Purpose
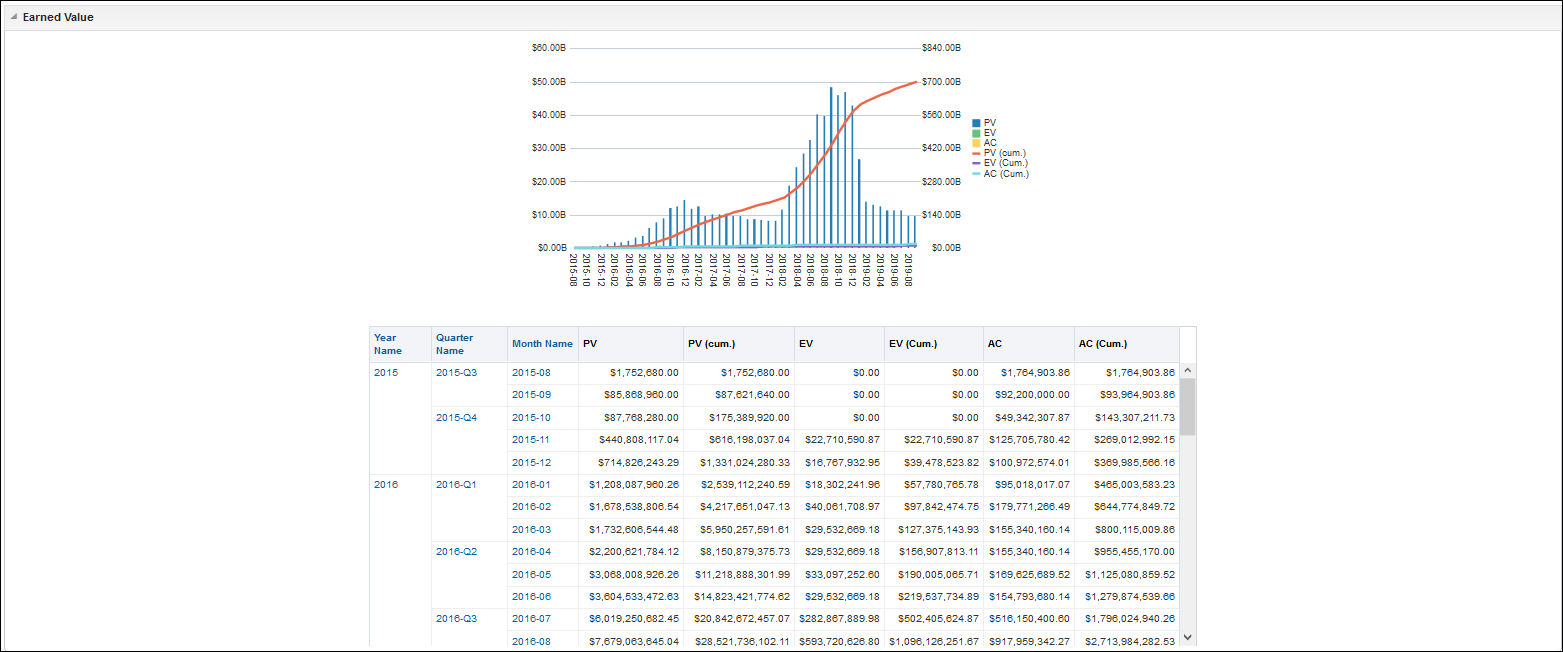
The line-bar chart shows cost information:
- Bars for Actual Total Cost, Earned Value (Cost), Planned Value (Cost), and Estimate At Completion (Cost)
- Lines for cumulative values of Actual Cost, Earned Value, Planned Value, and Estimate At Completion
The x-axis of the chart shows the year and month. The y-axis for the bars, on the left, shows period Cost. The y-axis for the lines, on the right, shows Cost (Cumulative).
The pivot table breaks down cost data by year, quarter, and month. Depending on the Filter criteria, the table contains columns for:
- Year Name
- Quarter Name
- Month Name
- Planned Value (Cost)
- Planned Value (Cumulative)
- Earned Value (Cost)
- Earned Value (Cumulative)
- Actual Total Cost
- Actual Cost (Cumulative) /
Location
- On the Home page, click Dashboards.
- Under Primavera, select Project Earned Value.
- On the Project Earned Value dashboard, click Unifier, and then click the Overview page.
- On the Overview page, expand the Earned Value section.
Subject Area
Activity