Purpose
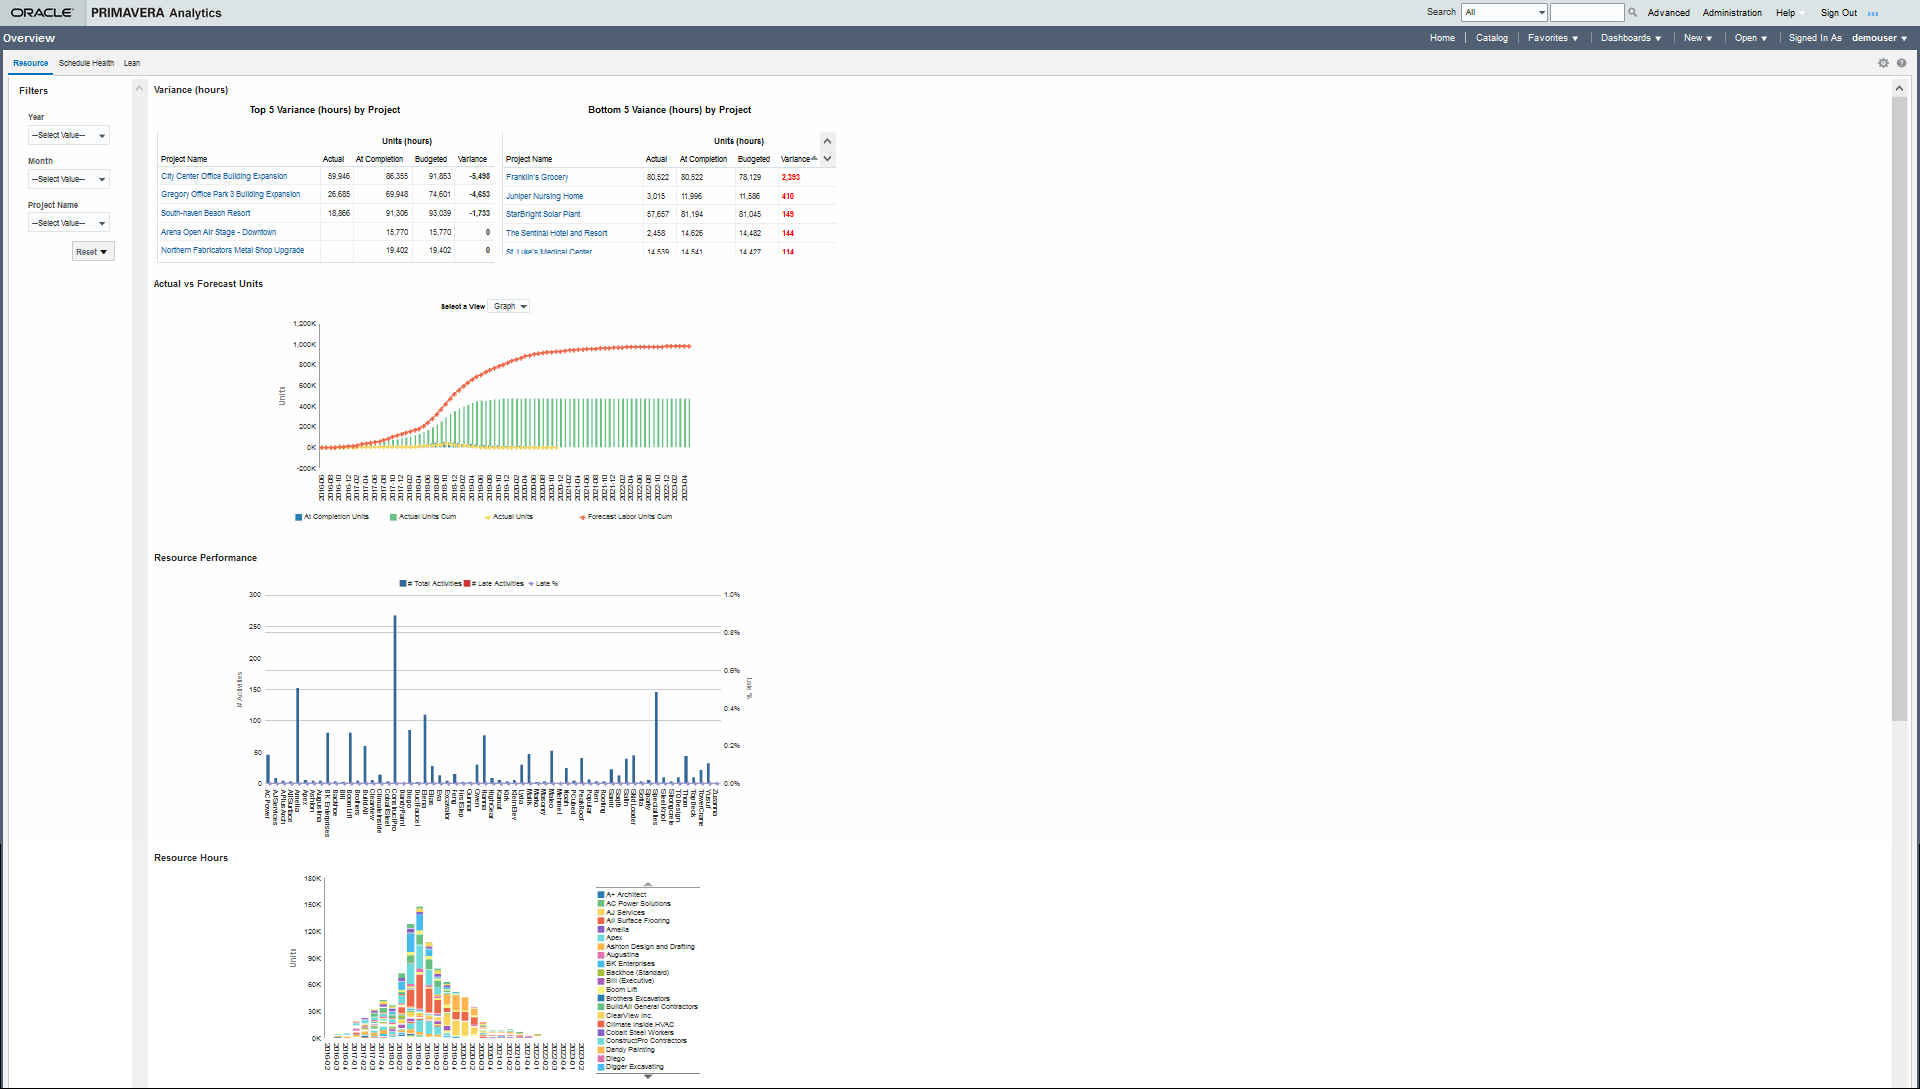
The Variance (hours) section displays the extent of variance by comparing the Actual hours, Budgeted hours, and the At Completion Units (hours) for projects that are ahead of schedule and behind schedule. Select a Project Name to review the list of activities and their corresponding Actual, At Completion, and Budgeted Units (hours) with the variance value associated with each activity. The cumulative variance of all the activities is the variance (hours) for that project.
The Actual Vs. Forecast Units section displays the cumulative Forecasted Labor Units versus the Actual Units used by resources, and calculates the variance over a period of time. Use the Select a View list, to view this information as a graph (default) or table. The bar chart shows how resource hours were distributed over a selected period. The x-axis shows months and years. The y-axis shows units of time. In the bar chart, double-click on a column bar to view the following information associated with each project worked on by a resource in a specific month:
- Planned Units
- Actual Units
- Remaining Units
- At Completion Units
- Actual Units Variance (calculated as the difference of Actual Units and the At Completion Units)
If you chose the table view for Actual Vs. Forecast Units, the following information displays for each resource name:
- Actual Units
- At Completion Units
- Actual Units Cumulated
- Forecast Labor Units Cumulated
The Resource Performance section displays the efficiency of resources in completing their activities by evaluating late activities as a percentage of the total activities for each resource. The x-axis of the bar chart displays the resource names. The y-axis displays the # Activities and Late % for each resource. Double-click on a specific column bar in the bar chart to view all the activities associated with a specific resource name, and those completed late by the resource.
The Resource Hours section displays a stacked histogram to depict the total At Completion units of each resource used in each quarter of a specific period. The total at completion units for that quarter can be spread across one or more resources. The x-axis of the bar chart displays the resource names. The y-axis displays the resource units. In the bar chart, double-click a segment of a column bar to view the At Completion Units used by a resource across one or more projects in a specific quarter.
Alternatively, from the Resource Name list, select a resource name to view the At Completion Units used by the resource for each project across several quarters in the selected period.
In the left pane, use the Filters section to view the resource usage and variance for a specific year, month, or project.
Location
- On the Home page, click Dashboards.
- Under Primavera Cloud, and select Overview.
- On the Overview dashboard, click the Resource tab.
Subject Area
Primavera Cloud - Resource Assignment