Siebel CRM Monitoring Architecture
The following solution architecture diagram shows all the software components that capture, transform, propagate, store and display metrics data of all necessary elements of a Siebel Server deployment on OKE by SCM.
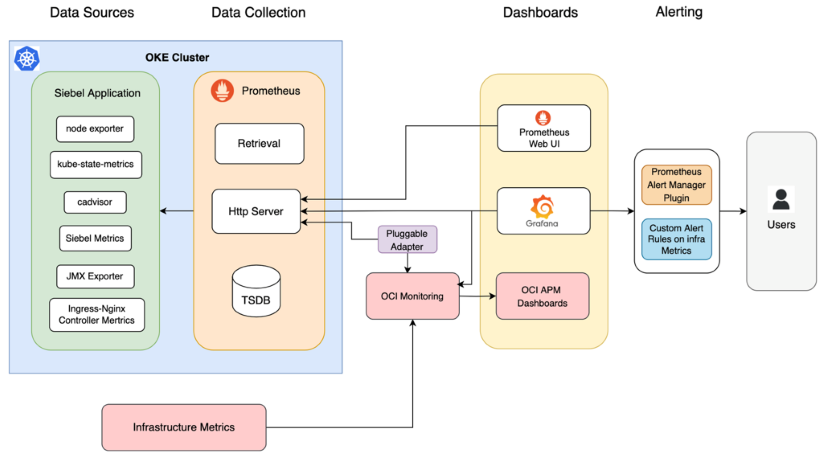
A large array of metrics related to networks, disks, nodes, pods, containers, database, Kubernetes and Siebel deployment components are collected and transmitted for viewing and analysis. cAdvisor is the metrics exporter for running containers. Other categories of metrics exporters include node exporters, kube-state -metrics exporters, Siebel metrics exporter, JMX exporters and NginX ingress controller metrics exporter.
These metrics are scraped/collected and stored in time series database in Prometheus, which, along with OCI infrastructure service metrics, feeds into Prometheus Web UI, Grafana and OCI monitoring console for viewing the collected metric. Information from these flows are also used by Prometheus Alert Manager plugin, which, in addition to OCI alerting services, can be configured to notify users of incidents that match defined criteria.