Using the Integration Network Monitor
This section discusses how to:
Set up the Network Monitor.
Select nodes to monitor.
Fetch and synchronize Network Monitor data.
Monitor asynchronous network service operations.
Monitor synchronous network service operations.
Activate and deactivate network domains.
Resubmit and cancel network transactions.
System administrators use the Integration Network Monitor to monitor integrations among other PeopleSoft systems defined in the integration network. Many of the pages and functions of the Network Monitor resemble those in the monitoring pages of the Service Operations Monitor. The major differences are that with the Network Monitor you are not limited to monitoring activity on the local node; you can monitor activity any remote PeopleSoft node defined in the network.
Network Monitor Features
The Network Monitor provides the following features:
Status on queues, nodes, and individual service operations.
Control and administer domains that have publication and subscription (pub/sub) servers running against the current database.
You can activate or deactivate domains, recover from stalls, and so forth.
Continue to use the Service Operation Monitor to perform the following tasks:
View and edit XML.
Archive data.
Run batch processes to receive notification of issues affecting the messaging system.
Administrative tasks, such as administer domains, view and maintain queue status, delete orphaned data after segment batch processing errors, define custom components for monitoring activities, and so on.
See the product documentation for Integration Broker Service Operations Monitor
Network Monitor Pages
The Network Monitor features the following pages:
|
Field or Control |
Definition |
|---|---|
| Monitor Overview |
Use the Monitor Overview page (IB_INTNET_PUBCON) for a high-level overview of the status of asynchronous service operation transactions. You can group transactions by queue or service operation for viewing. |
| Operation Instances |
The Operation Instances page (IB_INTNET_PUBHDR) enables you to monitor the status and details related to individual asynchronous service operation instances. |
| Publication Contracts |
The Publication Contracts page (IB_INTNET_PUBCON) shows outbound publication transactions to send to remote nodes. |
| Subscription Contracts |
The Subscription Contracts page (IB_INTNET_SUBCON) enables you to view transactions to which the local node subscribes. Subscription contracts for remote nodes do not appear. |
| Synchronous Transactions |
The Synchronous Transaction page (IB_INTNET_SYNC) enables you to view synchronous transactions. |
| Domain Status |
The Domain Status page (IB_INTNET_DOMSTAT) enables you to view and activate domains in the integration network. |
In addition, every page of the Network Monitor features these links:
|
Field or Control |
Definition |
|---|---|
| Monitor Setup |
Click the link to access the Network Monitor Setup page to modify setup options, such as the number of rows to return for a query. |
| Search Details |
Click the link to retrieve a summary detail for a specific transaction. When you enter a transaction ID for an asynchronous transaction the Asynchronous Details page appears. When you enter a transaction ID for a synchronous transaction the Synchronous Details page appears. |
Network Monitor Security
Upon accessing the monitor, you can see a list of all transactions in the system. However, to see specific information about a transaction and to view transaction details, you must have permission to the service operation.
The Network Monitor uses the same asynchronous and synchronous processing statuses as those that appear in the Service Operations Monitor.
See Understanding Asynchronous Service Operations StatusesUnderstanding Synchronous Service Operation Statuses.
Note the following prerequisites for using the Network Monitor:
You must set up Network Monitor options using the Network Monitor Setup page. The options you set on the page apply to your monitoring activity in the Network Monitor and the Transactional Tracker.
Information about setting up these options is provided elsewhere in this chapter.
To track transactions with remote PeopleSoft nodes the remote nodes must be active and defined in the integration network.
The Synchronous Transactions provides links the Synchronous Details page for viewing logging data. To capture logging data for a service operation you must set the log level on the routing definition for the service operation.
|
Field or Control |
Definition |
|---|---|
 |
Click the button to show sender and receiver details in one view, instead of on separate sender and receiver tabs. Click the button again to collapse the view. |
| Filter |
Click the button to filter the fetched data using the filters selected. |
| Last Sync |
The read-only field displays the date and time that the transaction data was refreshed. |
| Monitor Setup |
Click the link to access the Network Monitor Setup page to modify setup options, such as the number of rows to return for a query. |
| Network Node List |
Displays the active integration network nodes for which you can track activity. |
| Re-Sync Monitor Data |
Click the button to refresh the fetched data. The system automatically refreshes the data when you initially access any of the pages in the Transactional Tracker and when you initially select a node in the Network Node List. |
| Search Details |
Click the link to retrieve a summary detail for a specific transaction. When you enter a transaction ID for an asynchronous transaction the Transactional Tracker Details page appears. When you enter a transaction ID for a synchronous transaction the Synchronous Details page appears. |
| Time Period |
Use the options in the Time Period section to limit the query results to transactions that occurred during a specific date range or that occurred between a specific date and time range. |
Use the Network Monitor Setup page (IB_INTNET_MONSETUP) to set up Integration Network Monitor and Transactional Tracker options, such as the number of rows to display in the monitor, date/time ranges for query results, and more.
To access the page, select and click the Network Monitor Setup link.
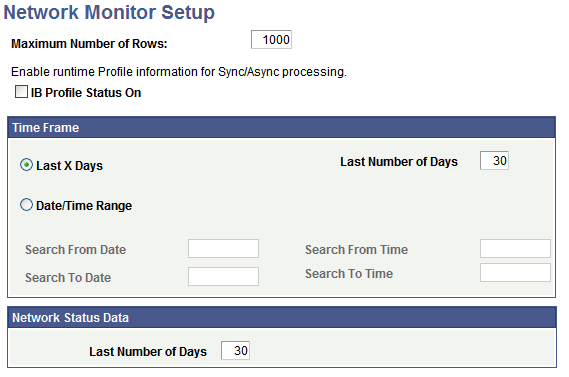
Image: Network Monitor Setup page
This example illustrates the fields and controls on the Network Monitor Setup page.
Specifying the Number of Rows to Return
Use the Maximum Number of Rows field on the Network Monitor Setup page to specify the number of rows to return as search results. The default value is 1000 rows.
There is no minimum or maximum value that you can set for this parameter. Consider integration volume when setting this value.
Enabling Integration Broker Performance Statistics
Check the IB Profile Status On field on the Network Monitor Setup page to enable the collection and display of runtime Integration Broker performance statistics.
Defining Date and Time Ranges for Query Results
Use the Time Frame section on the Network Monitor Setup page to define the date and time range in which query results should fall.
By default, the system returns search results for activity that has taken place in the past 30 days. However, you change the day range, or set parameters based on date and time ranges.
To define a date range in which query results are to fall:
Select the Last X Days radio button.
In the Last Number of Days field, enter a value.
By default the value is 30, and the system returns query results for the last 30 days of activity.
To define a date and time range in which query results are to fall:
Select the Date/Time Range radio button.
Select the date range.
In the Search from Date field, enter the start date of the date range.
Alternatively, click the calendar icon to select a date.
In the Search to Date field, enter the end date of the date range.
Alternatively, click the calendar icon to select a date.
Select the time range.
In the Search from Time field, enter the start time of the time range.
In the Search to Time field, enter the end time of the time range.
Time field format is HH:MI:SS.999999, where HH represents hours, MI represents minutes, SS represents seconds, and 999999 represents microseconds.
Defining the Date Range of Network Status Query Results
In the Network Status Data section, select the number of days for which to return results of network status information for the Network Status page.
The default value is 30 days.
Each page of the Network Monitor features a Network Node List. The Network Node List contains a list of active integration network nodes for which you can monitor integration activity. The Network Node List appears on all of the Network Monitor pages.
Image: Network Node List
This example illustrates the Network Monitor – Network Node List.
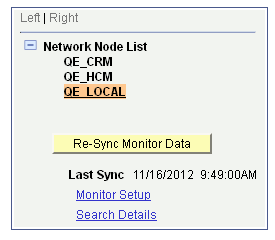
The example shows that there are three active network nodes for which you can monitor data, QE_CRM,QE_HCM and QE_LOCAL.. The QE_LOCAL node is highlighted and denotes that it is the currently selected node for monitoring network activity.
To change or select a node, click the node name in the tree.
When you select a node in the Network Node List, the system automatically resynchronizes and fetches the most current transaction data for the selected node.
The PeopleSoft system fetches and synchronizes Network Monitor data when you initially access the Network Monitor component and when you change nodes in the Network Node List.
You can also manually synchronize data by clicking the Re-Sync Monitor Data button. The Re-Sync Monitor Data button appears on each page of the Network Monitor under the Network Node List.
The synchronization process synchronizes and updates the fetched data with changes in the database since the last synchronization.
A Last Sync field appears under the Re-Sync Monitor Data button and displays the date and time that the monitor data was last synchronized, whether it be by manual synchronization or system synchronization.
Controls on the Monitor Overview, Operation Instances, Publication Contracts, Subscription Contracts, and Synchronous Transaction pages provide data filters that enable you to narrow the fetched data results to that data which is most relevant to you.
The filters are listed on the pages on which they appear and are described in the Monitoring Asynchronous Integration Network Service Operations and Monitoring Synchronous Integration Network Service Operations in the following topics:
“Common Elements Used to Filter and View Network Monitor Asynchronous Service Operation Data.”
“Common Elements Used to Filter and View Network Monitor Synchronous Service Operation Data.”
After choosing the filters, you click the Filter button to obtain the filtered results.
This section discusses how to:
Filter asynchronous network service operation data.
Monitor general asynchronous network service operation data.
Monitor asynchronous network service operation instances.
Monitor asynchronous network service operation publication contracts.
Monitor asynchronous network service operation subscription contracts.
Common Elements Used to Filter and View Network Monitor Asynchronous Service Operation Data
The following elements are used to filter and view the query results of Network Monitor service operation data.
|
Field or Control |
Definition |
|---|---|
|
Click the button to show sender and receiver details in one view, instead of on separate sender and receiver tab. Click the button again to collapse the view. |
| Alias |
Service operation alias name if defined for the service operation. |
| Correlation ID |
Identifier used to correlate messages sent separately into a single transaction. |
| Creation Dttm |
Creation date and time. |
| External Service Name |
The name of the inbound service operation received from an integration partner. This name is equivalent to the routing alias. |
| Filter |
Click the button to filter the fetched data using the filters selected. |
| Group By |
Indicates how the system groups returned data. The valid values are:
|
| Last Update Dttm |
Last update date and time. |
| Orig Transaction ID |
The original transaction ID generated and used for the service operation instance. As contracts are created another transaction ID is created for each publication or subscription contract. However, the original transaction ID is always available as a reference. |
| Publish, Publish Node, Node Name |
Indicates the node that published the service operation. |
| Publish Dttm |
Publish date and time. |
| Queue Level |
Indicates the pub/sub queue for which to display information. The valid values are:
|
| Queue Name |
Name of the service operation queue. |
| Queue Sequence ID |
Identifies the sequence of a particular service operation in a queue. This field is applicable to only service operations in ordered queues. |
| Segment Number |
When message segments are implemented, indicates the number of the segment message |
| Service Operation |
Name of the service operation. |
| Service Operation Version, Version |
Indicates the version of the service operation. |
| Status, Status String |
Processing status of the service operation. The Network Monitor uses the same processing statuses as those that appear in the Service Operations Monitor. See Understanding Asynchronous Service Operations StatusesUnderstanding Synchronous Service Operation Statuses. |
| Sub Node |
The name of the subscribing node. |
| Sub Queue |
If queue partitioning exists for a queue, a Sub Queue column appears in the Results grid on the Operation Instances page, Publication Contracts page and Subscription Contracts page . Click the link to open the Sub Queue Message Queue page to view all transactions in the sub queue. |
| Timestamp |
Date and time of the publication. |
| Time Period |
Use the options in the Time Period group box to limit the query results to transactions that occurred during a specific date range or that occurred between a specific date and time range. The Time Period group box features four fields for searching by date and time: From Date, To Date, From Time and To Time. If you complete just the date fields, the time fields automatically populate from 12:01 a.m. to 11:59 p.m. When left blank, no date or time is used as part of the search criteria. |
| Transaction ID |
The unique identifier for a transaction. |
Monitoring General Asynchronous Network Service Operation Information
Use the Monitor Overview page (IB_INTNET_OVRVIEW) for a high-level overview of the status of asynchronous service operation transactions in the integration network. You can group transactions by queue or service operation for viewing. To access this page, select
Image: Network Monitor – Monitor Overview page
This example illustrates the Network Monitor – Monitor Overview page.
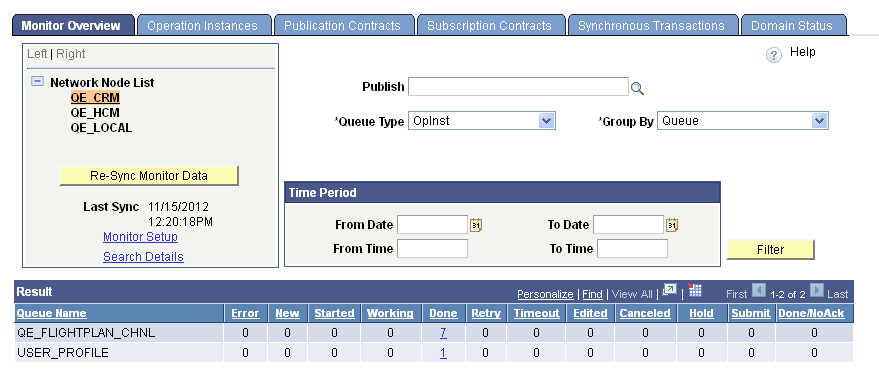
When you access the page, the system automatically synchronizes the with the database for the selected node in the Network Node List. The processing status of asynchronous transactions appears in the Results grid at the bottom of the page. The number of operation instances in a particular status display as a linked value. Click the link to open the data in the Operation Instances page where you can view more detailed information.
If you change the node for which to view information, by clicking a different node name in the Network Node List, the system automatically resynchronizes the page with the most up-to-date transaction information for the node.
By default, the system queries the database by service operation queue for operation instance information.
You can query the database by modifying the query filters and then clicking the Filter button. The filters available on the page are:
Publish.
Query Level.
Group By.
Time Period.
The data filters and data elements that appear in the Results grid are described in the Common Elements Used to Filter and View Asynchronous Network Monitor Data section of this topic.
Monitoring Asynchronous Network Service Operation Instances
Use the Operation Instances page (IB_INTNET_PUBHDR) to monitor the status and details related to individual asynchronous service operation instances. To access this page, select and click the Operation Instances tab.
Image: Network Monitor – Operation Instances page
This example illustrates the Network Monitor – Operation Instances page.
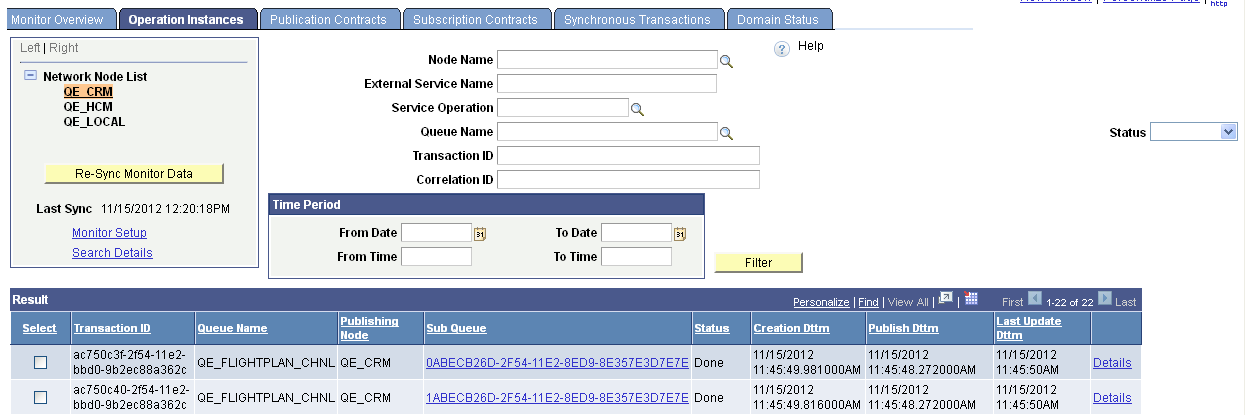
The example shows a partial view of the query results appearing in the Results grid.
If you change the node for which to view information, by clicking a different node name in the Network Node List, the system automatically resynchronizes the page with the most up-to-date transaction information for the node.
By default, the system queries the database by service operation queue and the asynchronous processing status Done.
You can query the database by modifying the query filters and then clicking the Filter button. The filters available on the page are:
Node Name.
External Service Name.
Service Operation.
Queue Name.
Transaction ID.
Correlation ID.
Status.
Time Period.
Query results appear in the Results Grid. If the queue in which a transaction is processed is partitioned, a hyperlinked transaction ID appears in the Sub Queue column in the Results grid. Click the link to view all network service operations in the sub queue.
For each transaction in the Results grid a Details link appears. Click the Details link access the Asynchronous Details page and to view additional details for the transaction. Based on the processing status of the transaction, the Asynchronous Details page enables you to view any transaction error messages and resubmit or cancel the transaction.
The data filters and data elements that appear in the Results grid are described in the “Common Elements Used to Filter and View Asynchronous Network Monitor Data” section of this topic.
Monitoring Asynchronous Network Service Operation Publication Contracts
Use the Publications Contracts page (IB_INTNET_PUBCON) to monitor the status and details related to asynchronous service operation publication contracts. To access this page, select and click the Publication Contracts tab.
Image: Network Monitor – Publication Contracts page
This example illustrates the Network Monitor – Publication Contracts page. A partial view of the query results appear in the Results grid at the bottom of the example..
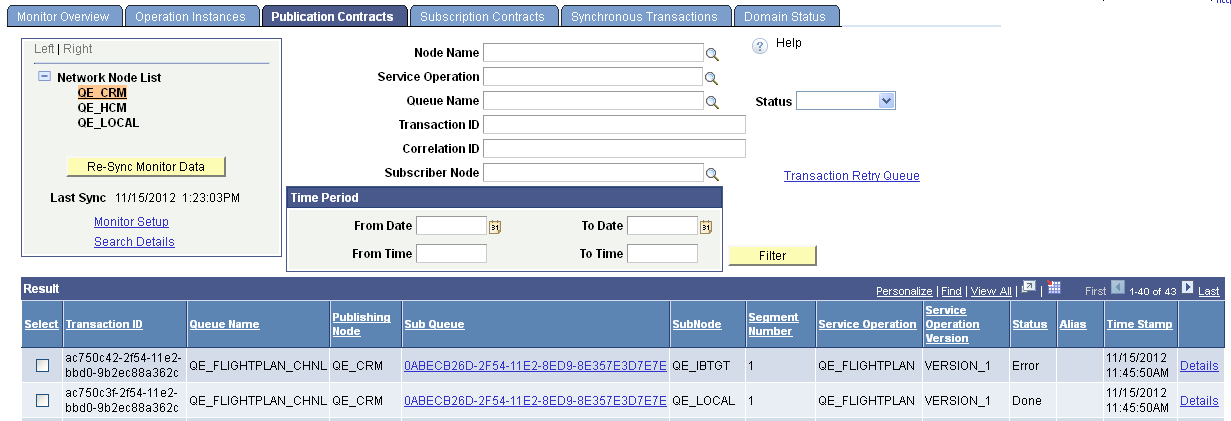
If you change the node for which to view information, by clicking a different node name in the Network Node List, the system automatically resynchronizes the page with the most up-to-date transaction information for the node.
By default, the system queries the database by service operation queue and the asynchronous processing status Done.
You can query the database by modifying the query filters and then clicking the Filter button. The filters available on the page are:
Node Name.
Service Operation.
Queue Name.
Status.
Transaction ID.
Correlation ID.
Subscriber Node.
Time Period.
Query results appear in the Results grid.
The data filters and data elements that appear in the Results grid are described in the Common Elements Used to Filter and View Asynchronous Network Monitor Data section.
If the queue in which a transaction is processed is partitioned, a hyperlinked transaction ID appears in the Sub Queue column in the Results grid. Click the link to view all network service operations in the sub queue.
For each transaction in the Results grid a Details link appears. Click the Details link to access the Asynchronous Details page (IB_INTNET_DET) and to view additional details for the transaction. Based on the processing status of the transaction, the Asynchronous Details page enables you to view any transaction error messages and resubmit or cancel the transaction.
Image: Network Monitor – Asynchronous Details page
This example illustrates the details for an asynchronous network publication contract.
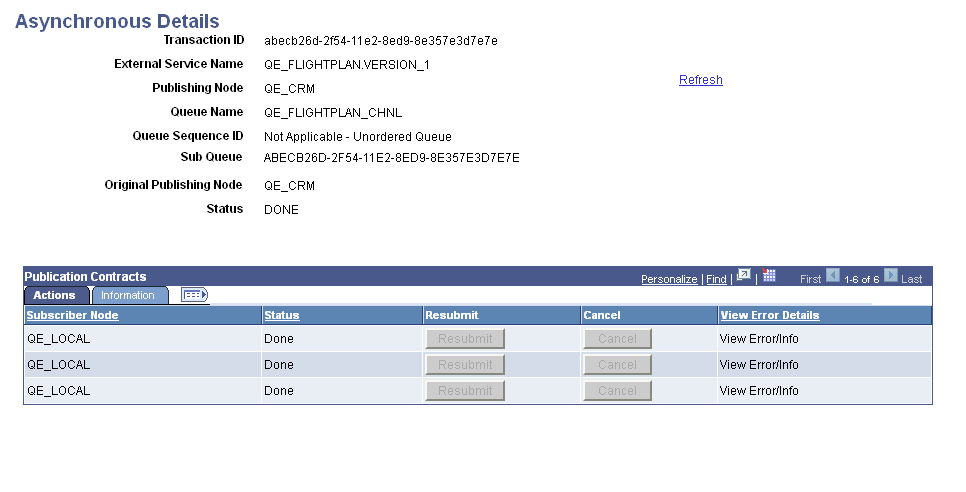
The top portion of the Asynchronous Details page shows the information that appears in the Results grid of the Publication Contracts page.
The Publication Contracts grid at the bottom of the page shows additional information about the transaction.
The Actions tab shows each node that is subscribing to the contract. In this example, the QE_LOCAL is subscribing to the contract. Depending on the processing status, the Resubmit and Cancel buttons are active and you can perform those related actions.
See Resubmitting and Cancelling Integration Network Transactions.
If there are any processing errors with a transaction, a View Info Details link appears. Click the link to view the error information. .
The Information tab reveals details about the publication transaction, including the transaction ID, the transaction time stamp, and so on.
Monitoring Asynchronous Network Service Operation Subscription Contracts
Use the Subscription Contracts page (IB_INTNET_SUBCON) to monitor the status and details related to asynchronous service operation subscription contracts. To access this page, select and click the Subscription Contracts tab.
Image: Network Monitor – Subscription Contracts page
This example illustrates the Network Monitor – Subscription Contracts page.
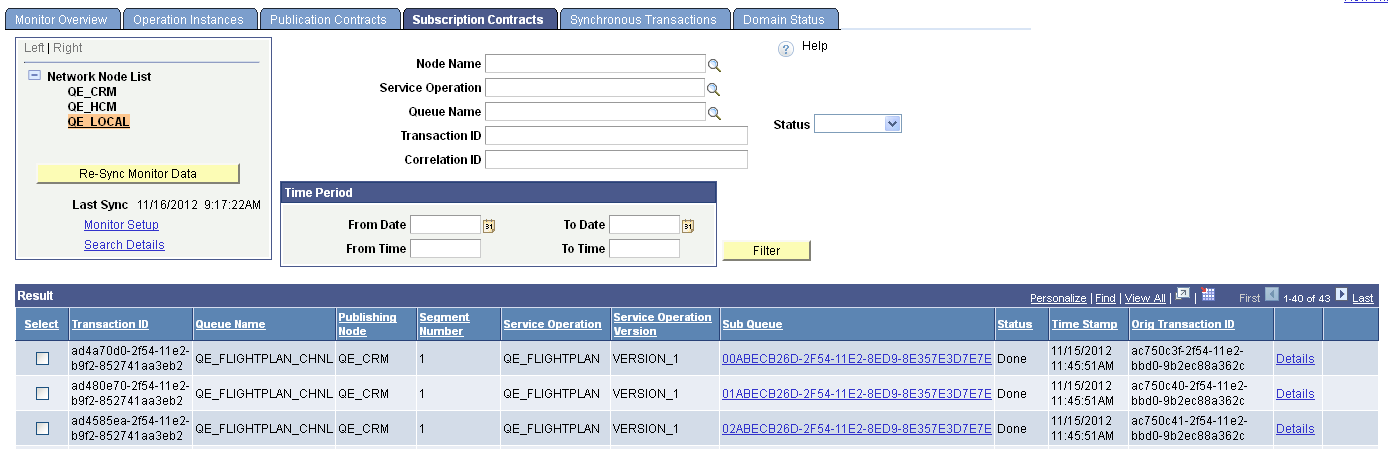
If you change the node for which to view information, by clicking a different node name in the Network Node List, the system automatically resynchronizes the page with the most up-to-date transaction information for the node.
By default, the system queries the database by service operation queue and the asynchronous processing status Done.
You can query the database by modifying the query filters and then clicking the Filter button. The filters available on the page are:
Node Name.
Service Operation.
Queue Name.
Status.
Transaction ID.
Correlation ID
Time Period.
Query results appear in the Results grid.
The data filters and data elements that appear in the Results grid are described in the Common Elements Used to Filter and View Asynchronous Network Monitor Data section.
If the queue in which a transaction is processed is partitioned, a hyperlinked transaction ID appears in the Sub Queue column in the Results grid. Click the link to view all network service operations in the sub queue.
For each transaction in the Results grid a Details link appears. Click the Details link to access the Asynchronous Details page and to view additional details for the transaction. Based on the processing status of the transaction, the Asynchronous Details page enables you to view any transaction error messages and resubmit or cancel the transaction.
Image: Network Monitor – Asynchronous Details page
This example illustrates the Network Monitor – Asynchronous Details page for an asynchronous network subscription contract.
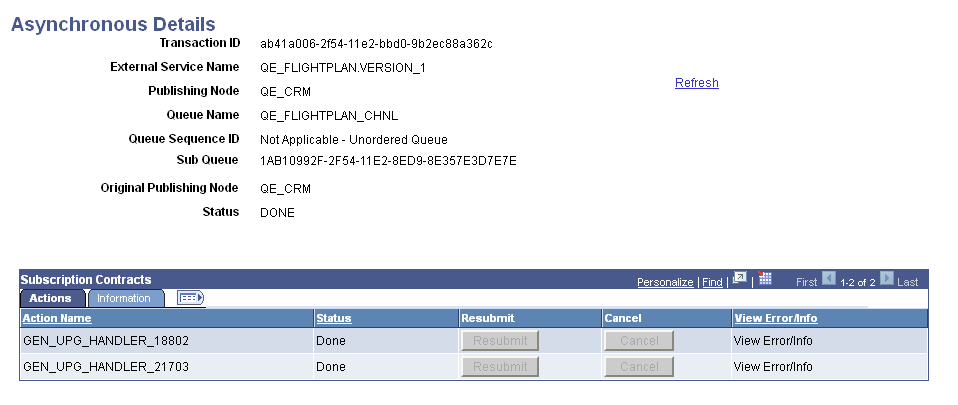
The top portion of the Asynchronous Details page shows the information that appears in the Results grid of the Subscription Contracts page.
The Subscription Contracts grid at the bottom of the page shows additional information about the transaction.
The Actions tab shows the service operation handler name for the subscription contract. Depending on the processing status, the Resubmit and Cancel buttons are active and you can perform those related actions.
See Resubmitting and Cancelling Integration Network Transactions.
If there are any processing errors with a transaction, a View Info Details link appears on the Actions tab. Click the link to view the error information.
The Information tab reveals details about the subscription transaction, including the transaction ID, the transaction time stamp, and so on.
This section discusses how to monitor synchronous network service operation transactions.
Common Elements Used to Filter and View Network Monitor Synchronous Service Operation Data
The following elements are used to filter and view the query results of Network Monitor service operation data.
|
Field or Control |
Definition |
|---|---|
| Destination Publish Node |
Identifies the name of the node where the service operation was sent. |
| External Service Name |
The name of the inbound service operation received from an integration partner. This name is equivalent to the routing alias. |
| Filter |
Click the button to filter the fetched data using the filters selected. |
| Final Destination |
Identifies the name of the node of the final destination for the service operation. |
| Last Update Dttm |
Last update date and time. |
| Non-Repudiation ID |
Identifies a unique number used to associate a service operation instance with the nonrepudiation log. |
| Pub/Sub Timestamp |
Identifies the date and time that the service operation instance was last processed. |
| Publish, Pub Node |
Indicates the node that published the service operation. |
| Publish Dttm |
Publish date and time. |
| Segment Number |
When message segments are implemented, indicates the number of the segment message |
| Service Operation |
Name of the service operation. |
| Service Operation Version, Version |
Indicates the version of the service operation. |
| Status, Status String |
Processing status of the service operation. The Network Monitor uses the same processing statuses as those that appear in the Service Operations Monitor. See Understanding Asynchronous Service Operations StatusesUnderstanding Synchronous Service Operation Statuses. |
| Timestamp |
Date and time of the publication. |
| Time Period |
Use the options in the Time Period group box to limit the query results to transactions that occurred during a specific date range or that occurred between a specific date and time range. The Time Period group box features four fields for searching by date and time: From Date, To Date, From Time and To Time. If you complete just the date fields, the time fields automatically populate from 12:01 a.m. to 11:59 p.m. When left blank, no date or time is used as part of the search criteria. |
| Trans Type |
Indicates the type of synchronous transaction. The valid values are:
|
| Transaction ID |
The unique identifier for a transaction. |
| Updated Date/Time |
Identifies the date and time the service operation was last updated. |
Monitoring Synchronous Network Service Operation Transactions
Use the Synchronous Transactions page (IB_INTNET_SYNC) to monitor the status and details related to synchronous service operations in the integration network. To access this page, select and click the Synchronous Transactions tab.
Image: Network Monitor – Synchronous Details page
This example illustrates the Network Monitor – Synchronous Details page.
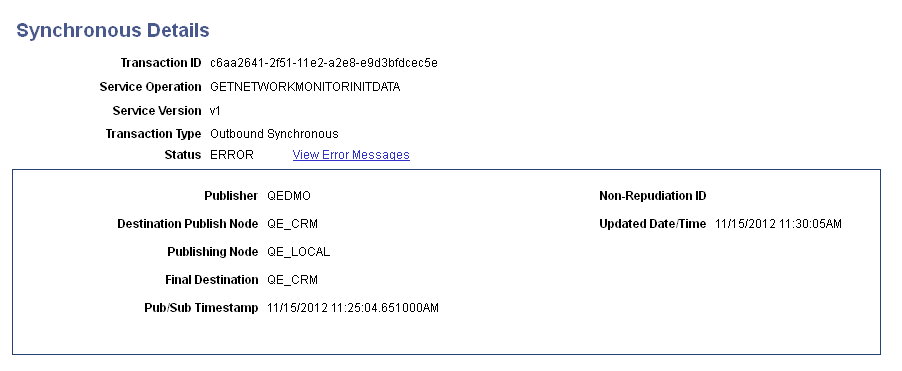
Image: Network Monitor – Synchronous Transactions page
This example illustrates the Network Monitor – Synchronous Transactions page. A partial view of the query results appears in the Results grid at the bottom of the example.
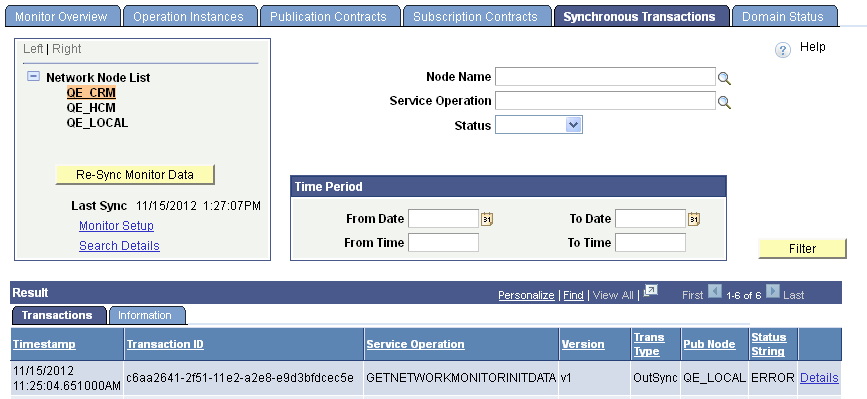
If you change the node for which to view information, by clicking a different node name in the Network Node List, the system automatically resynchronizes the page with the most up-to-date transaction information for the node.
You can query the database by modifying the query filters and then clicking the Filter button. The filters available on the page are:
Node Name.
Service Operation.
Status.
Query results appear in the Results grid.
The data filters and data elements that appear in the Results grid are described in the Common Elements Used to Filter and View Synchronous Network Monitor Data section.
For each transaction in the Results grid a Details link appears. Click the Details link to access the Synchronous Details page (IB_INTNET_SYNC_DET) and to view additional details for the transaction. Based on the processing status of the transaction, the Asynchronous Details page enables you to view any transaction error messages and resubmit or cancel the transaction.
Image: Network Monitor – Synchronous Details page
This example illustrates the Network Monitor – Synchronous Details page.
If there are any processing errors with a transaction, an Error Messages link appears, like the one shown in the example. Click the link to view error message information.
Use the Domain Status page (IB_INTNET_DOMSTAT) to monitor the status of the domain for the node selected in the Network Node List. To access this page, select and click the Domain Status tab.
Image: Network Monitor – Domain Status page
This example illustrates the Network Monitor – Domain Status page. Use this page to activate domains in the network.
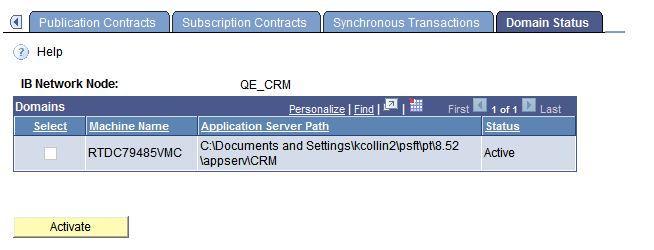
Use the page to activate the domain of the selected node in the Network Node List, as necessary.
To activate a network node:
Access the Domain Status page ( and click the Domain Status tab).
The Network Monitor – Monitor Overview page appears.
In the Network Node List, select a node.
Click the Domain Status tab.
In the Domains grid, select the domain to activate.
Click the Activate button.
This section discusses how to:
Resubmit or cancel individual network transactions for processing.
Resubmit or cancel network transactions for processing in bulk.
Understanding Resubmitting and Canceling Network Transactions for Processing
You can resubmit and cancel network transactions for processing for only those to which you have permissions. If you attempt to resubmit or cancel a transaction for which you do not have permission, the system ignores the action.
Understanding Resubmitting and Canceling Future-Dated Network Transactions
You can cancel a future-dated transaction in the network monitor as you would any other transaction. However, when you cancel a future-dated transaction, the future date information is not retained. So if you subsequently resubmit the transaction, the system immediately submits it for processing.
Resubmitting and Canceling Individual Network Transactions
To resubmit or cancel individual transactions, select the check box next to the appropriate transaction and click the Resubmit or Cancel button. To deselect a transaction, clear the check box next to the transaction.
Resubmitting and Canceling Network Transactions in Bulk
You can resubmit and cancel network transaction for processing in bulk using the Network Monitor. Network transactions to resubmit in bulk must be in one of the following statuses:
Cancel.
Edited.
Error.
Timeout.
Network transactions to cancel in bulk must be in one of the following statuses:
Edited.
Error.
Hold. (The transaction must also be future-dated.)
New.
Retry.
Timeout.
In addition to the Clear All, Resubmit and Cancel buttons, you can also use the following links when resubmitting and canceling network transactions in bulk:
|
Field or Control |
Definition |
|---|---|
| Select All |
Click the link to select all network transaction in the results grid to resubmit or cancel. After you click this link, click the Resubmit or Cancel button as appropriate. |
| Deselect All |
Click the link to deselect all network transactions selected in the results grid. |