Using the Statistics Pages
PeopleSoft Integration Broker provides a Statistics page where you select the service operation transaction type of the performance statistics to view. To access the page select
Image: Statistics page
Use the Statistics page to select the service operation transaction type of the system performance statistics to view.
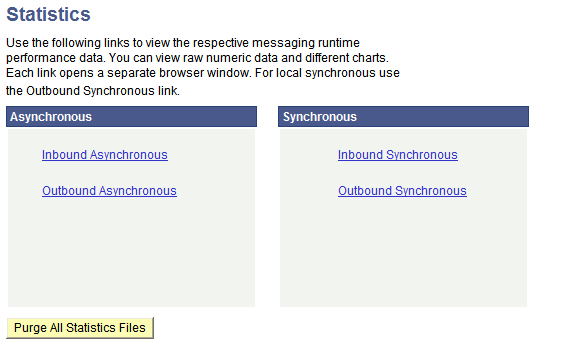
The Statistics page presents four categories of service operation transaction types for which you can view performance statistics.
After you select a service operation transaction type, a separate window appears that contains a search dialog box. The search dialog box that appears is based on the transaction type you selected. Use the page to enter search criteria for data to retrieve and view.
Image: Inbound Asynchronous page
Use the Inbound Asynchronous page to search for inbound asynchronous messaging system performance statistics to view.
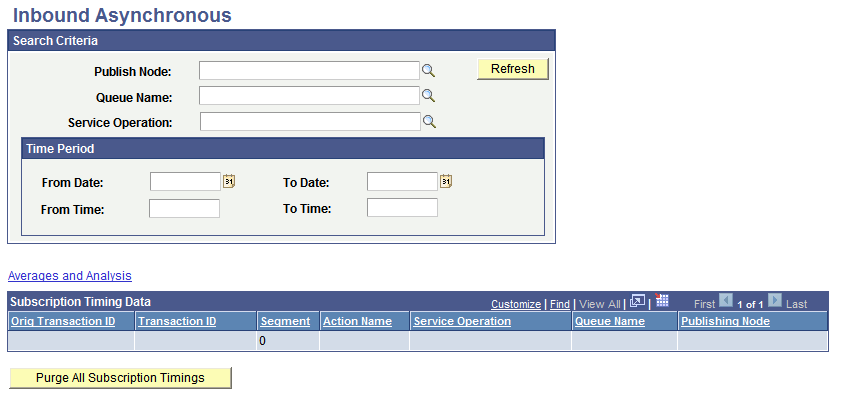
After you enter your search criteria and press the Refresh button, the system displays the search results in the results. If you enter no search criteria and simply press the Refresh button, the system displays all performance statistics in the database for the transaction type.
Image: Inbound Asynchronous page
This example shows a completed search for inbound asynchronous performance statistics for the publishing node QE_LOCAL. The results grid shows general data about the transactions in numeric format.
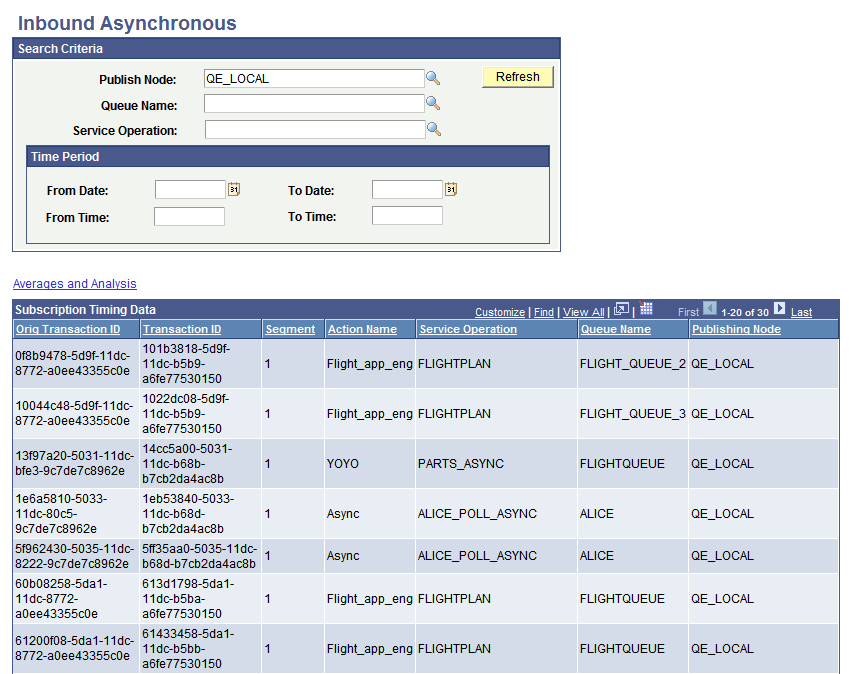
The Subscription Timing Data grid in the previous graphic shows partial results of all results returned.
The results grid shows general data about the transactions in numeric format.
Note: Due internal system processing, not all transactions profiled display in the results grid. However averages displayed are accurate.
Based on the transaction type of the data you're viewing, the system displays additional options to view more detailed data and data in graphical format.
For example, when you click the Averages and Analysis link for inbound asynchronous system performance data, a graphical display of the messaging system component displays. Next to each graphic is a numeric link, which corresponds to the amount of processing time on the component.
Image: Averages and Analysis page
This example shows the Averages and Analysis page for inbound asynchronous transactions.
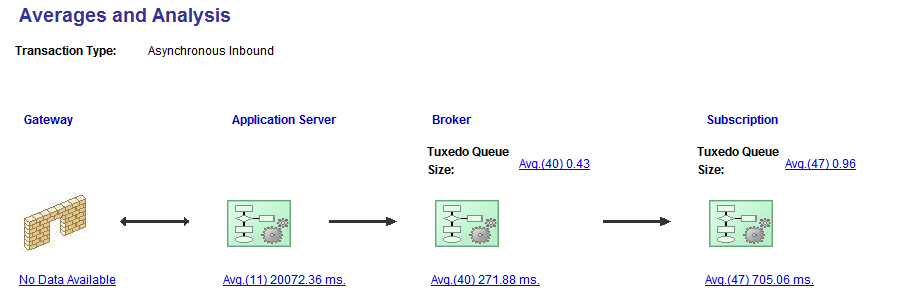
The flow of the transactions are from left to right. In this case you are viewing inbound asynchronous processes, therefore the integration gateway receives the requests and sends the Jolt requests to the application server. The broker evaluates the subscription contracts, and then subscription processing takes place.
Click the links under each component to view more detailed information about processing times during system processing.
When you click the link under the Subscription on the Averages and Analysis page, the Subscription Contract Averages page appears.
Image: Subscription Contract Averages page
This example shows the Subscription Contact Averages page.
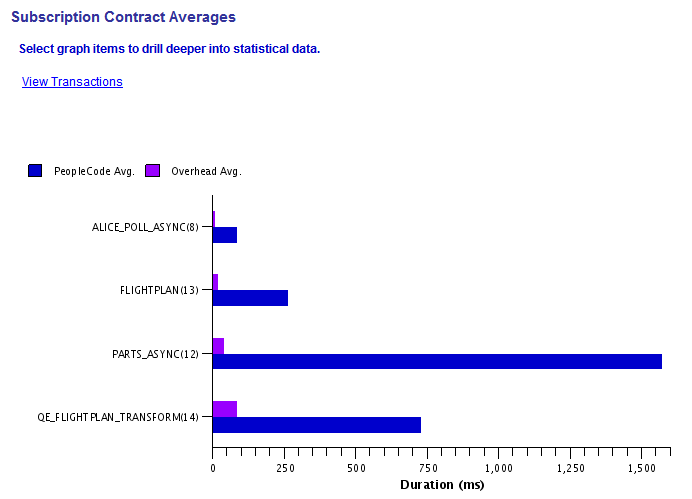
The Subscription Contract Averages page depicts subscription processing times in graphical format. In this example, the bar chart shows the average time for PeopleCode processing and overhead processing for the service operations ALICE_POLL_ASYNC, FLIGHTPLAN,PARTS_ASYNC, and QE_FLIGHTPLAN_TRANSFORM. The number in parentheses next to each service operation name is the number of transactions involving that service operation reflected in the data.
To view the transactions that comprise the graphical representation shown, click the View Transactions link. The transactions appear in the Subscription Contracts Details grid of the Subscription Contract Details page..
Image: Subscription Contract Details page
This example shows the Subscription Contract Details page. The information in the Subscription Contract Details grid is the raw data on which the graphs are based on the Subscription Contract Averages page.
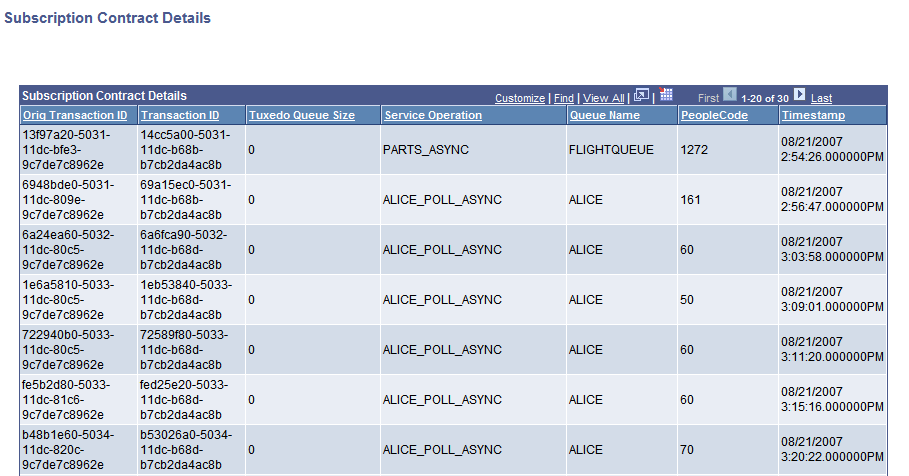
Note that this is a partial example and does not show all the data on which the bar charts in the previous graphic are based.