Using the Gantt Class
Use the Gantt class to create Gantt charts. A Gantt chart displays tasks and milestones along a time line. Gantt charts are frequently used in project management because they provide a graphical illustration of a schedule, which helps in planning, coordinating, and tracking project tasks.
This section provides an overview of Gantt chart terminology and discusses how to use the Gantt Class.
Many of the elements, such as titles and labels, available on conventional chart like the bar chart are also available on the Gantt chart. The following terms apply specifically to Gantt charts:
|
Field or Control |
Definition |
|---|---|
| Activity or Task |
See Task. |
| Baseline |
A point-in-time snapshot of the project plan that allows the user to identify how the project plan has changed since that point in time. |
| Data area |
The part of the chart that graphically shows the span of dates that each task (or activity) covers. (This area is the right side of the displayed chart.) |
| Dependencies |
A relationship between one task and other tasks that drives when tasks can begin and end. A dependent task cannot start before the task it is dependent on is either started or completed (depending on business rules defined in the application). |
| Milestone |
A specialized mark on the chart that names a meaningful point in time. |
| Resource |
A source of supply or support that is assigned to work on an activity or task. |
| Task or Activity |
In a Gantt chart, each row (task or activity), is represented in the y-axis of the chart, and the span of dates for each row is displayed on the x-axis. |
| X-axis |
The x-axis displays dates that are spanned by items in the y-axis. |
| X-axis labels |
The part of the chart that lists the time scale. The x-axis labels support multiple levels of granularity: second, minute, hour, day, week, month, year. |
| Y-axis |
The y-axis is the display of tasks or activities, and is displayed as rows. |
| Y-axis labels |
The part of the chart that lists activities and their attributes. Activities are shown hierarchically, and subtasks can be hidden or displayed by expanding or collapsing higher level tasks. |
Image: Example Gantt chart
The Gantt chart consists of two sections: a table section and a chart section.

The left side of the chart, where you see the table, is the table section. The other side, where you see the bars, is the chart section. Horizontal scroll bars below the table section support scrolling through the task-related columns; below the task section, they support scrolling through the charted tasks. Vertical scroll bars (when present) support scrolling through the task list.
Table Section
The table section contains all of the tasks and associated subtasks, and displays them in a hierarchy. Tasks that contain subtasks are called parent tasks, and subtasks are called child tasks. You can click on the expand (collapse) image to the left of the task name (Baby, above) to expand or collapse the subtask hierarchy. Note that subtasks may also act as parent tasks to other subtasks.
Each task has a name (Born, Baby, Childhood, and so on). It also has a level. Parent tasks have a higher level than child tasks.
Chart Section
The chart section displays the tasks, task dependencies, and milestones graphically.
In the previous example, each horizontal bar represents a single task. The progress bar (that is, the percentage complete for a particular task) is indicated with a bar of a different color above the task bar. The milestone date (Graduate in the previous example) is represented with a circle.
You can also have dependencies between tasks. These are represented as lines connecting the task bars.
You can execute custom FieldChange PeopleCode when a user clicks a task bar or a task dependency line.
User Interaction
A user can interact directly with a chart to change the underlying chart data.
These user actions are supported:
Resize the task bar.
Reposition the task bar.
Reposition a milestone glyph.
Move the separator between the table section and the chart section.
Update task details, task start time and end time, and the progress bar.
When a user changes values in the chart section by dragging and dropping bars, the Planned Start, Planned End, and Progress values in the grid column will also be updated if the grid and the chart section use the same record and fields.
Note: Drag-and-drop is not supported on an Apple iPad.
You can control the level the user is able to interact with the chart using the Gantt class properties InteractiveStart, InteractiveEnd, InteractiveProgress, and InteractiveMove.
See InteractiveStart, InteractiveEnd, InteractiveProgress, InteractiveMove.
Every Gantt chart has at least one data set used to define the tasks and the information related to each task, such as start date, end date, milestones, percent finished, and so on.
A second data set can be used to describe dependencies between tasks.
The following methods are required for using the Gantt chart:
SetTaskData
Use this method to specify where most of the information for the Gantt chart is stored. You can specify either a rowset or a record.
SetTaskID
Use this method to specify the task ID, or name, of the task. Every task must have a unique task identifier. The task ID is used to support task linking and dependencies.
SetPlannedStartDate
Use this method to specify the planned starting date of the task. Each task must have its own planned starting date.
SetPlannedEndDate
Use this method to specify the planned ending date of the task. Each task must have its own planned ending date.
Though not required, Oracle recommends using the SetTaskName method to display meaningful information in the table section of the Gantt chart.
If you only use the required methods and do not use the SetTaskAppData method, Oracle recommends that you also use the SetChartArea method and dedicate most, if not all, of the entire area to the chart, and not the table.
If you specify one actual date, either for start or end, then you must specify the other (SetActualStartDate, SetActualEndDate).
In addition, if you want to use dependency data, the following methods are required:
SetTaskDependencyData
Use this method to specify where most of the information for the dependency data is stored. You can specify either a rowset or a record.
SetTaskDependencyParentID
In a dependency, one task depends on another. Use this method to specify the parent task, that is, the one that the other (child) task depends upon.
SetTaskDependencyChildID
In a dependency, one task depends on another. Use this method to specify the child task, that is, the one that depends on another.
The date-time axis (the x-axis) of a Gantt chart is referred to as the “time line” axis. You can control the display label format for the time line through a combination of user personalization settings and various Gantt class methods for setting date entity formats. These settings and methods are described in this documentation. The time line’s start and end can also be adjusted by using the Timeline Range picker or by using the AxisStartDateTime and AxisEndDateTime methods. If none of the properties or methods is set for controlling the time line, then the charting engine plots the time line based on the time difference between the earliest start date and latest end date of all tasks in the Gantt chart.
The time line axis can display the following units of measure: years, months, days, hours, minutes, and seconds. The time line does not support the following units: centuries, quarter years (such as Q1, Q2, and so on), weeks, and milliseconds.
Depending on the time difference between the earliest start date/time and latest end date/time of the data displayed in the Gantt chart, the chart is displayed with a minor axis only, or with major and minor axes.
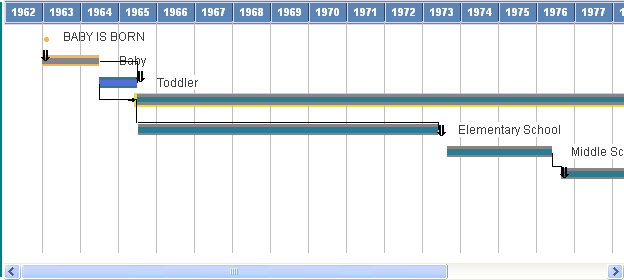
Image: Time line with minor axis only (years)
The following Gantt chart displays a minor axis only due to the wide range between the start and end dates of the displayed data:

Valid pairs of major and minor axes include:
Year and month
Month and day
Day and hour
Hour and second
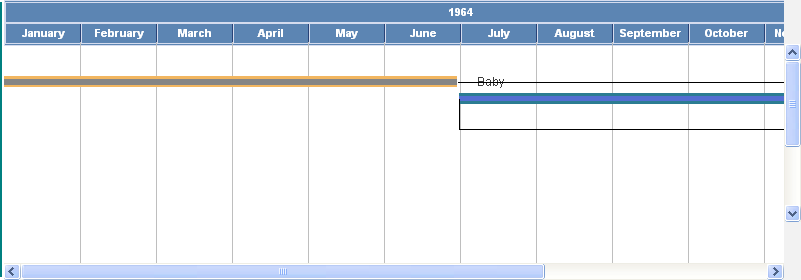
Image: Time line with a major axis (year) and minor axis (months)
The following Gantt chart displays both a major and a minor axis:

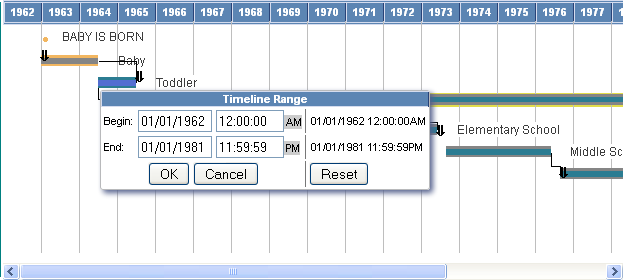
Image: Timeline Range picker
The Timeline Range picker is activated by a clicking a date on the time line. Use the Timeline Range picker to specify the start and end date and time for the data to be displayed in the Gantt chart:

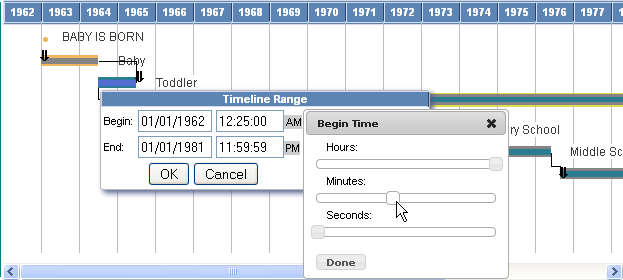
Image: Timeline Range picker with date slider
The date slider is activated by clicking a time in the Timeline Range picker. Click AM or PM to toggle between these two settings.

You must set the end date to be after the start date, for both the planned as well as actual dates, or else you will receive an error.
Both the start and end dates you specify for a task must fall within the axis dates, that is, the dates specified by the AxisEndDateTime and AxisStartDateTime properties. If you specify task dates that fall outside of the axis dates, the task appears in the table section of the Gantt chart, but no bar appears in the chart section of the Gantt chart, even if one of the dates falls inside the axis dates.
You can use all of the following glyphs with a Gantt chart. You can use either the numeric or constant value.
Note: For values that have been deprecated, the new value is substituted automatically.
|
Numeric Value |
Constant Value |
Glyph |
Notes |
|---|---|---|---|
|
1 |
%ChartGlyph_Axe |
NA |
This constant has been deprecated; use %ChartGlyph_X (17) instead. |
|
2 |
%ChartGlyph_Bar |
NA |
This constant has been deprecated; use %ChartGlyph_Exclamation (13) instead. |
|
3 |
%ChartGlyph_Box |
NA |
This constant has been deprecated; use %ChartGlyph_Fisheye (25) instead. |
|
4 |
%ChartGlyph_Circle |
● |
NA |
|
5 |
%ChartGlyph_Cross |
NA |
This constant has been deprecated; use %ChartGlyph_Dagger (20) instead. |
|
6 |
%ChartGlyph_Diamond |
◆ |
NA |
|
7 |
%ChartGlyph_Dodecahedron |
NA |
This constant has been deprecated; use %ChartGlyph_Triangle_Inverted (18) instead. |
|
8 |
%ChartGlyph_Icosahedron |
NA |
This constant has been deprecated; use %ChartGlyph_Star (11) instead. |
|
9 |
%ChartGlyph_Sphere |
NA |
This constant has been deprecated; use %ChartGlyph_CrossHairs (21) instead. |
|
10 |
%ChartGlyph_Square |
■ |
NA |
|
11 |
%ChartGlyph_Star |
★ |
NA |
|
13 |
%ChartGlyph_Exclamation |
! |
NA |
|
14 |
%ChartGlyph_QuestionMark |
? |
NA |
|
15 |
%ChartGlyph_Asterisk |
✻ |
NA |
|
16 |
%ChartGlyph_Check |
✔ |
NA |
|
17 |
%ChartGlyph_X |
× |
NA |
|
18 |
%ChartGlyph_Triangle_Inverted |
▼ |
NA |
|
19 |
%ChartGlyph_Dollar |
$ |
NA |
|
20 |
%ChartGlyph_Dagger |
† |
NA |
|
21 |
%ChartGlyph_CrossHairs |
⊕ |
NA |
|
22 |
%ChartGlyph_Euro |
€ |
NA |
|
23 |
%ChartGlyph_Yen |
¥ |
NA |
|
24 |
%ChartGlyph_PoundSterling |
£ |
NA |
|
25 |
%ChartGlyph_Fisheye |
◉ |
NA |
A Gantt object can be instantiated only from PeopleCode. You can use this object only in PeopleCode programs that are associated with an online process, not in an Application Engine program, a message notification, a Component Interface, and so on.
Gantt objects are declared using the Gantt data type. For example:
Local Gantt &MyGantt;The PeopleCode program is terminated if a field or record is missing at runtime.
If a valid record is specified but no data is found, or for any other error, the chart is replaced by the message "Image creation failed."