Using the RatingBoxChart Class
A rating box chart is an interactive chart that displays nodes on a two-dimensional grid. If drag-and-drop is enabled for the chart, a user can move the nodes from one quadrant to another on the grid. When the user moves a node, the underlying data is updated automatically.
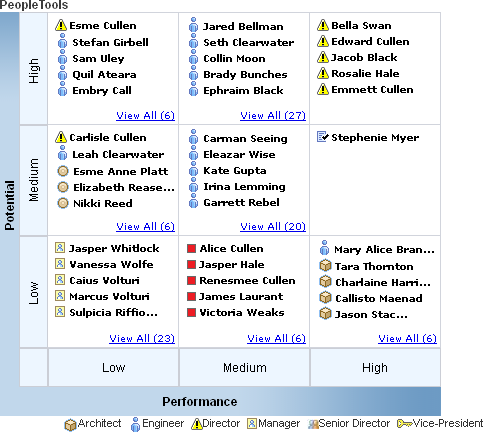
Image: Rating box chart used to graph performance and potential
The rating box chart in this example displays ratings on the dimensions of potential and performance. The nine combinations of ratings produces a grid with nine quadrants:
This section provides an overview of rating box chart terminology and discusses how to use the RatingBoxChart Class.
The following is a list of terms that apply specifically to rating box charts.
|
Field or Control |
Definition |
|---|---|
| Box |
A rating box chart is an array of boxes (referred to as quadrants) arranged in a grid along the x and y axes. See Quadrant for more information. |
| Description |
A text string that is associated with a node. The node description optionally displays with the node icon. |
| Icon |
An image associated with a node that displays in a quadrant on the rating box chart. |
| Node |
A single data point on a rating box chart. A node represents an individual entity, such as an employee, customer, or product. You can drag-and-drop a node to other quadrants in the rating box chart grid. |
| Node record |
A record that contains the properties and data values for each node on the rating box chart. The node record must include a copy of the subrecord PTRATINGBIX_SBR. |
| Quadrant |
A rating box chart is an array of quadrants arranged in a grid along the x and y axes. Each quadrant represents a pair of ratings, one for the x value and one for the y value. Each quadrant can display a custom label as defined by an instance of the QuadrantSchema class. See Using the QuadrantSchema Class. |
| Rating |
A text string that is assigned to each quadrant in the rating chart. Each quadrant has an x rating, based on its position on the horizontal axis, and a y rating, based on its position on the vertical axis. |
| Title |
There are three titles: Main title, x-axis title, and y-axis title. A title is text that identifies that portion of the chart. |
A rating box chart displays nodes on a chart that is divided into two or more quadrants arrayed in a grid.
An application can correlate nodes, represented by icons, with various entities, such as employees, customers, or products, and various attribute pairs, such as potential/performance, cost/benefit, or opportunity/risk.
A user interacts with the rating box by dragging nodes to different quadrants. When a node is moved, its underlying x (horizontal) and y (vertical) values are updated. A user can also interact with the rating box by changing a node’s x or y values in the grid that contains the rating box values if the application makes the grid visible and editable.
To drag and drop a node using an Apple iPad, tap the node's description. A copy of the node with a red dashed border appears. Then tap the quadrant to which you want to move the node. The node appears in the new location.
The View all pop-up automatically closes if the user moves a node to another quadrant.
Using PeopleCode, you can associate each node with an image, or icon, and a description. You can configure a rating box to display nodes with icons and descriptions or with only icons.
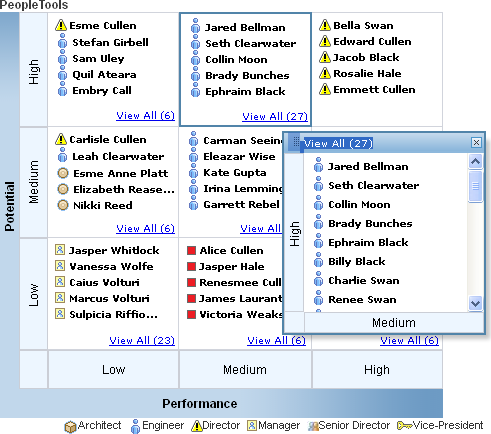
Image: Rating box chart with a pop-up displaying all nodes for a quadrant
If a quadrant contains more nodes than the number set in the RatingBoxChart property BoxMaxDisplayItems, the user can click a link at the bottom of the quadrant to launch a pop-up that contains all the nodes. The quadrant border changes color to indicate that the quadrant has a pop-up open. A vertical scrollbar enables the user to scroll through all the nodes in the list as shown in this example:
When you add a rating box chart to a page in Application Designer, you use the chart properties to associate the chart control with a record field. You will use this field name to identify the chart in PeopleCode.
You will need to create a record that will be the rating box chart node record. The record can be a standard database record or a derived/work record. The node record holds the values for the properties and data for each of the rating box chart nodes.
The record can have any name, but it must include a clone of the PeopleTools-delivered subrecord PTRATINGBOX_SBR. Since the subrecord will carry the FieldChange PeopleCode for the chart, in most cases you should create a unique subrecord for each chart. The node record must be placed on a page at level one on the component so that its PeopleCode will be loaded into the component buffer. It can be hidden.
In your chart PeopleCode, typically in the Activate event, you will create and populate a rowset linked to the chart’s node record. This must be a component rowset, linked to the chart’s node record, not a standalone rowset. The rowset has one row for each node in the chart.
Actions and Events
When the IsDragable property is set to True, drag-and-drop is allowed for the rating box chart. Otherwise, drag-and-drop is not allowed.
When a user drags the node from one quadrant to another, PeopleTools updates the values for the node’s PTXAXISRATINGS and PTYAXISRATINGS values, changing the node’s x and y values to the new values. This change invokes field change processing on the PTXAXISRATINGS and PTYAXISRATINGS fields on the rating box node record. Typically, FieldChange PeopleCode performs business logic and refreshes the chart display.
Text Orientation
The orientation of the main title in a rating box chart is always horizontal.
The orientation of the x-axis title and x-axis labels is always horizontal.
The orientation of the y-axis title and y-axis labels is always vertical.
These are the fields in PTRATINGBOX_SBR:
|
Field |
Description |
|---|---|
|
PTCHART_NODE |
Specifies the node name. This is the key to the record. |
|
PTND_DISPLAY_ORDER |
Specifies the display order of the nodes within the chart. By default nodes will display in the same order as in the rowset. You must provide a unique value for display order for each node in the rating box rowset so that the nodes will display in the correct order in the chart. A runtime error message is thrown when the display order is not unique for each node in the rating box rowset. |
|
PTNODE_DESCR1 |
Specifies the main description for the node. |
|
PTNODEDESCRSTYLE |
Specifies the style class that defines the description’s text font, type, color, size, and so on. |
|
PTNDDESC1LINKABLE |
Reserved for future use. |
|
PTDESCR1_ICON_IMG |
Specifies the image name for the main description. |
|
PTDESCR1_ICON_POS |
Indicates where to place the icon relative to the description. L – Left of the description R – Right of the description |
|
PTXAXISRATINGS |
Specifies the x-axis rating for the current node. |
|
PTYAXISRATINGS |
Specifies the y-axis rating for the current node. |
|
DISPLAYED_FLAG |
Indicates whether the node will display in the chart area. Y – The node will display in the chart area. N – The node will not display in the chart area. The default value is “Y”. |
At a minimum these methods are needed to create a rating box chart.
SetRBNodeData
SetRBNodeRecord
SetXAxisLabels
SetYAxisLabels
At a minimum, these properties are needed to create a rating box chart.
XAxisBoxNum
YAxisBoxNum
These properties are required if the chart includes a view all pop-up:
PopUpWidth
PopUpHeight
You can attach instances of the QuadrantSchema class to your rating box chart to provide additional information to users. Specifically, you can label quadrants in the rating box chart.
Image: Rating box chart with quadrant labels
In the following example, six of the nine available quadrants in the rating box chart are associated with a QuadrantSchema object and have custom labels; the other three quadrants are unlabeled.
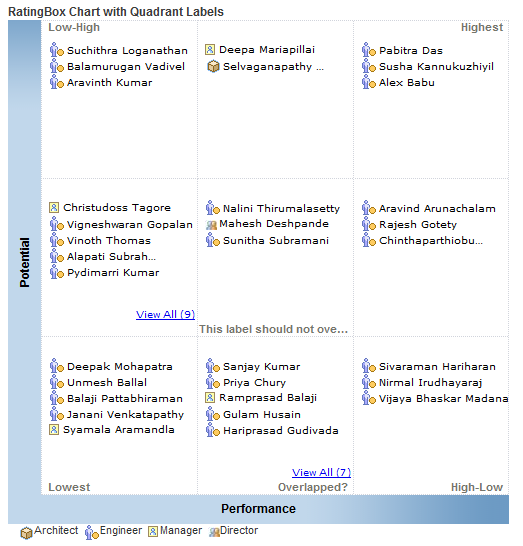
Each label is defined by an instance of QuadrantSchema. These instances are created independently in PeopleCode and then attached as an array to your instance of RatingBoxChart.
For each instance of QuadrantSchema you must specify the x-value/y-value pair that defines the quadrant for the text. You can also specify the location of the text within the quadrant.
The following PeopleCode example demonstrates how to create unique instances of QuadrantSchema, set their properties, and assign them to a rating box chart in order to display a custom label in six rating box quadrants.
/****************** Create Quadrant Schema  1*****************/
&oQuadrantSchema1 = CreateObject("QuadrantSchema");
&oQuadrantSchema1.XRating = "Low";
&oQuadrantSchema1.YRating = "Low";
&oQuadrantSchema1.LabelText = "Lowest";
&oQuadrantSchema1.LabelPosition = %Bottom_Left;

/****************** Create Quadrant Schema  2*****************/
&oQuadrantSchema2 = CreateObject("QuadrantSchema");
&oQuadrantSchema2.XRating = "High";
&oQuadrantSchema2.YRating = "High";
&oQuadrantSchema2.LabelText = "Highest";
&oQuadrantSchema2.LabelPosition = %Top_Right;

/****************** Create Quadrant Schema  3*****************/
&oQuadrantSchema3 = CreateObject("QuadrantSchema");
&oQuadrantSchema3.XRating = "Medium";
&oQuadrantSchema3.YRating = "Medium";
&oQuadrantSchema3.LabelText = "This label should not overflow the quadrant!";
&oQuadrantSchema3.LabelPosition = %Bottom_Right;

/****************** Create Quadrant Schema  4*****************/
&oQuadrantSchema4 = CreateObject("QuadrantSchema");
&oQuadrantSchema4.XRating = "High";
&oQuadrantSchema4.YRating = "Low";
&oQuadrantSchema4.LabelText = "High-Low";
&oQuadrantSchema4.LabelPosition = %Bottom_Right;

/****************** Create Quadrant Schema  5*****************/
&oQuadrantSchema5 = CreateObject("QuadrantSchema");
&oQuadrantSchema5.XRating = "Low";
&oQuadrantSchema5.YRating = "High";
&oQuadrantSchema5.LabelText = "Low-High";
&oQuadrantSchema5.LabelPosition = %Top_Left;
rem &oQuadrantSchema5.LabelPosition = 4;

/****************** Create Quadrant Schema  6*****************/
&oQuadrantSchema6 = CreateObject("QuadrantSchema");
&oQuadrantSchema6.XRating = "Medium";
&oQuadrantSchema6.YRating = "Low";
&oQuadrantSchema6.LabelText = "Overlapped?";
&oQuadrantSchema6.LabelPosition = %Bottom_Right;
Then, the following portion of the program builds an array of these instances and that then associates that array to the instance of RatingBoxChart:
&QuadrantSchemas = CreateArray(&oQuadrantSchema1, &oQuadrantSchema2, &oQuadrantSchema3, &oQuadrantSchema4, &oQuadrantSchema5, &oQuadrantSchema6);

&oRatingBoxChart.SetQuadrantSchemas(&QuadrantSchemas);

/* Reduce clutter in the chart by hiding the axis labels */
&oRatingBoxChart.ShowAxisLabels = False;Chart objects are declared using the Chart data type. For example,
Local RatingBoxChart &RatingBoxChart;A chart object can be instantiated only from PeopleCode.
You can use this object only in PeopleCode programs that are associated with an online process, not in an Application Engine program, a message notification, a Component Interface, and so on.