Viewing Completed PMUs
Access the Completed PMUs page (PeopleTools, Performance Monitor, History, Completed PMUs).
Note: The search result of completed PMUs includes history information collected by agents even if they are currently marked inactive.
Note: If a "clone table" warning appears at the top of the page, the archive program is either currently running or has abnormally terminated. If this is the case, all new incoming information that is being sent to the monitoring system is currently being inserted into the clone tables. New performance data is not inserted into the current data tables until the archive program finishes successfully.
Note: When a process recycles or crashes, there may be a slight loss in data until the agent registers again.
Before you can view information about completed PMUs, you need to enter criteria so that you can locate the appropriate completed PMUs.
Use the Advanced Search link to expose all search criteria.
The maximum rows that are returned by the search depends on the value in the Search Row Limit field on the Global Administration page.
See Setting Global System Options.
|
Field or Control |
Definition |
|---|---|
| System ID |
Identifies each monitored system. PeopleSoft automatically generates this value incrementally. System definitions are created automatically when the first agent of a monitored system registers with the monitoring system. |
| Database Name |
The name of the PeopleSoft application database running on the monitored system. The monitoring system automatically inserts this value when it recognizes and creates a monitored system. |
| User ID |
If you want information for a particular user, enter the user ID of the user for which you want to track completed PMUs. This field prompts against the PSPMOPRDEFN table. |
| Process ID |
Enables you to search completed PMUs by the process ID. |
| Performance Trace Name |
If a user has launched a performance trace in the Performance Trace Console, the system labels every PMU that is generated in a business process with a performance trace name. Select the appropriate trace name to view its results. The Performance Trace Name field prompts against the PSPMPERFTRACE table, which the Lookup program (PSPM_LOOKUP) populates. |
| Component |
If you want information for a particular component, enter the name of the component for which you want to track completed PMUs. This field prompts against the PSPMPNLGRPDEFN table. Note: Searching on a component is equivalent to searching on Context 1 for application server PMUs. |
| Market |
Enter the market that is associated with the component. |
| PMU Definition Set |
Indicates the set to which the PMU definition belongs. A PMU definition set is similar to a message set. This is required if you want to generate metric and duration charts. |
| PMU Identifier |
Identifies the PMU definition within a PMU definition set. This is required if you want to generate metric and duration charts. |
| Context 1, 2, 3 |
PMU metrics contain data that is specific to that PMU. Context values, on the other hand, are common to the entire user request or a specific tier. For example, the component name is stored in a context. The system uses contexts to "flatten" a PMU tree. For example, you do not have to navigate up from a SQL PMU to an ICPanel PMU to see what component generated that SQL statement. In some cases, PMU types are shared across different user request types. In such cases, the label for the PMU will be generic. Use the Context Help button to view the context definitions for a PMU set ID and ID that you've entered. |
| PMU Status |
Displays the PMU status. See Completed PMU Status. |
| Top Instance |
Each PMU that is reported by an agent has a unique instance ID. The instance identifier of the first PMU generated by a particular user request is the top instance. The value of the top instance is then stored with every child PMU within a request. The top instance is the associating value for all PMUs that are generated by the same user request. |
| Statement Number |
This search field applies only when you are searching for PeopleCode SQL PMUs, which are PMU 406 (PeopleCode SQL Execute) and PMU 407 (PeopleCode BuiltIn SQL Execute). The Context 2 field contains the PeopleCode program name andMetric 2 contains the statement number in the PeopleCode where the SQL was executed. To search by statement number, you must enter the following search criteria: PMU Definition Set = 1, PMU ID = 406 or 407, and Context 2 must have the name of a PeopleCode program. |
| From Date/Time To Date/Time |
Specify a range of time in which the system should search for completed PMUs. The system searches on the monitor date and time, not the agent date and time. |
| Duration |
Specify criteria that is related to the duration of a PMU in milliseconds. |
| Domain Name |
Select the application server domain to generate the PMUs. |
| Domain Host/Port |
Select the name and port number of the server machine on which the domain that generated the PMU resides. |
| Agent Identifier |
Identify the specific agent that monitored a PMU. |
| Agent Type |
Identify the type of agent that monitored a PMU. |
| Search |
The Search button performs a search based on the search criteria that is defined on the page. If you want to view the most current information, use theRefresh button after running the initial search. If you clickSearch repeatedly, the system returns the same results from the same time range for each search. |
| Refresh |
Updates the value in the To Time field to equal the current time and performs a search. This enables you to view the most current results of a search. |
At the bottom of the Completed PMUs page, the Completed PMUs grid contains the information that is related to the PMUs that are retrieved by your search criteria. The tabs in the Completed PMUs page are discussed in the following sections.
Summary
|
Field or Control |
Definition |
|---|---|
| PMU |
Indicates the name of the PMU. Click the PMU name to view the PMU Details page. |
| Duration |
Indicates the duration of the PMU from start to finish in milliseconds. |
| Complete Tree |
Click the tree icon to view the complete PMU tree, including all ancestor and descendant PMUs. |
| PMU Details |
Provides further description of the PMU. The details comprise contexts and metrics that are helpful for identifying the PMU. Each type of PMU displays a different set of details. |
| User |
Indicates the user whose request triggered the PMU. |
| PMU Status |
Displays the PMU status. See Completed PMU Status. |
| Monitor Received Date/Time |
Indicates when the monitor system received notification that a PMU had been started or updated. |
| Agent Start Date/Time |
Indicates that time according to the agent clock that the last update was received. |
| Domain Name |
Indicates the domain that handled the request that is associated with the PMU. |
Identifiers
The Identifiers tab presents the following additional information.
|
Field or Control |
Definition |
|---|---|
| PMU Set |
Identifies the set to which the PMU ID belongs. |
| PMU ID |
Identifies a PMU definition within a PMU set. |
| Agent ID |
Identifies the agent that reported the PMU. |
| Process ID |
The operating system process ID of the process that generated the PMU. |
| Instance |
A unique identifier that is generated by the system for each PMU. |
| Parent Instance |
The PMU that produced the PMU in this grid row. |
| Top Instance |
Each PMU that is reported by an agent has a unique instance ID. The instance identifier of the first PMU that is generated by a particular user request is the top instance. The value of the top instance is then stored with every child PMU within a request. The top instance is the value that associates all PMUs that are generated by the same user request. |
Contexts
The Contexts tab reveals the context definition and value that is associated with each PMU in the grid. To view the details of the contexts in a PMU, examine the context and PMU definitions.
This Description column shows data for the additional description value that is part of the incoming PMU. The description stores large character values and generally stores information that exceeds the 128–character limit of Metric 7 and the 254–character limit of the contexts.
See Context Definitions.
Metrics
The Metrics tab presents the metric values for all of the metrics that are defined for each PMU in the grid.
Metric information appears in a raw format. The values reflect exactly what is stored in the database.
See Metric Definitions.
Trees
The Trees tab enables you to view the PMU within the context of a PMU tree.
|
Field or Control |
Definition |
|---|---|
| View Ancestors |
Shows all parent PMUs for the selected PMU. This may be useful in determining the call tree of a child PMU. Only direct ancestors appear; sibling PMUs do not appear. |
| View Descendants |
Shows all child PMUs for the selected PMU. This may be useful in determining where the time is spent for a PMU. |
| Complete Tree |
Displays the entire tree representing the user request. If verbose or debug filters are set, this tree may contain a large number of nodes and may take a significant amount of time to load. |
Metric Charts
When your search criteria includes a PMU set and PMU identifier, all rows in the grid will be of the same type of PMU. In this case, the metric chart displays the metric values of the returned PMUs against one another. This enables you to track metrics over a period of time.
Image: Viewing a metric chart
This example illustrates the fields and controls on the Viewing a metric chart.
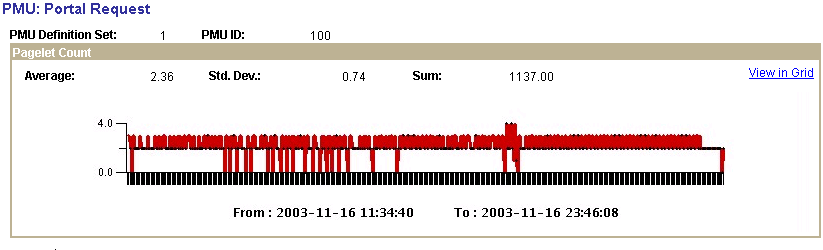
Numeric metrics may be of type Counter, Gauge, or Numeric Identifier. Numeric identifiers do not appear in charts. Gauges and counters do appear in charts, but the chart does not contain a sum value for gauges.
Use the View in Grid link to view the chart information in a grid so that you can download the information to an Microsoft Excel spreadsheet if needed.
Note: If the metrics of a PMU can't be charted, a message appears stating this fact.
Note: To view the metric chart, you must specify a PMU and PMU set ID as part of the search criteria. If you click this link when performance data for multiple PMUs appears, the system displays an error message.
Note: The data appearing on this chart is not manipulated by multipliers, if any are used.
See Metric Definitions.
Duration Charts
The duration charts show all durations for all PMUs appearing in the grid. The chart is time-based.
Image: Viewing a duration chart
This example illustrates the fields and controls on the Viewing a duration chart. You can find definitions for the fields and controls later on this page.
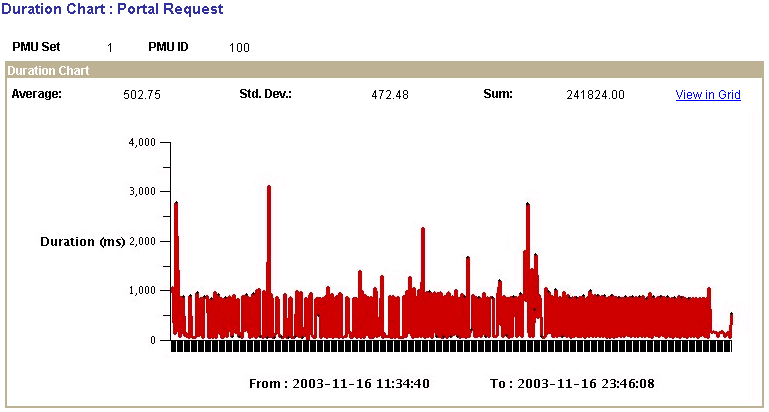
Use the View in Grid link to view the chart information in a grid so that you can download the information to an Microsoft Excel spreadsheet if needed.
Note: To view the duration chart, you must specify a PMU and PMU set ID as part of the search criteria. If you click this link when performance data for multiple PMUs appears, the system displays an error message.
A completed PMU can be assigned one of the following statuses:
|
Status |
Description |
|---|---|
|
Success |
The PMU finished successfully. |
|
Failed |
The PMU finished unsuccessfully. |
|
Abort |
Instrumentation code terminated a PMU due to an unexpected condition. |
|
Unknown |
Assigned in situations when an agent closes a child PMU if the top-level PMU closes out of sequence. |
|
Timeout |
Instrumentation code timed out the PMU. |
|
Reaper Timeout |
Long running PMU closed by the Reaper. |
|
Admin Timeout |
An administrator manually closed the PMU. This is not currently implemented. |
You can access the PMU details page from a variety of Performance Monitor pages, such as the Completed PMUs page and the Open PMUs page. You can also access it readily from trees. To access the page, you click the link that is created from the PMU name.
The PMU Details page indicates:
PMU ID and the PMU definition set to which it belongs.
Identification information.
Durations information, including metric values.
Context information.
Additional data.
The information that appears on the PMU Details page varies depending on the type of PMU that is displayed. All metrics are formatted according to information from the metric definition.
See Metric Definitions.