Logging System for PeopleSoft Process Scheduler Server
This section provides an overview on logging system for PeopleSoft Process Scheduler server.
The log directory stores the PeopleSoft Process Scheduler server logs and SQL trace files. Each server that is started in the PeopleSoft Process Scheduler server has its own set of log and trace files. The user does not normally need to review these files unless a problem occurs while running a process or some reason exists to verify that a process ran as expected.
Location of the Log and SQL Trace Files
The location and name of the PeopleSoft Process Scheduler log files depend on the operating system on which the PeopleSoft Process Scheduler Server is started.
|
Operating System |
Log Directory |
|---|---|
|
Windows |
PS_CFG_HOME\appserv\prcs\<Database Name>\LOGS |
|
UNIX |
PS_CFG_HOME/appserv/prcs/<Database Name>/LOGS |
|
OS390 UNIX System Services |
PeopleSoft Process Scheduler Server: $PS_HOME/appserv/prcs/<Database Name>/<Log Directory>/_PSPRCSRVLOG Distribution Agent Server: $PS_HOME/appserv/prcs/<Database Name>/<Log Directory>/_PSDSTSRVLOG |
The <Log Directory> corresponds to the directory that is specified in the Log/Output Directory variable in the PeopleSoft Process Scheduler configuration file (psprcs.cfg).
For each server that is started, two files are generated in the log directory:
The server log contains messages that are written by the server to the log file.
These messages are translated to the languages that are supported by the PeopleSoft system. The language of the messages is based on the language that is designated in the user profile.
The LogFence parameter, which is set in the PeopleSoft Process Scheduler configuration file, controls the detail of the message that is written to this log file.
The SQL trace file contains the traces of all SQL that is issued by the server.
This file is generated when the TraceSQL parameter in the PeopleSoft Process Scheduler configuration file has a value other than zero.
If a PeopleSoft Application Engine or Analytic Engine request is initiated by PSAESRV or PSAEOSRV respectively, the SQL traces that are generated from that process are stored in the process subdirectory that is located in the log and output directory.
Log and SQL Trace File Name in Windows and UNIX
The following table lists all the server names, log files, and SQL trace files in Windows and UNIX.
|
Server Name |
Description |
Log File |
SQL Trace File |
|---|---|---|---|
|
PSPRCSR V |
PeopleSoft Process Scheduler Server |
SCHDLR_<mmdd>.LOG |
<User ID>_PSPRCSRV.tracesql |
|
PSDSTSRV |
Distribution Agent |
DSTAGNT_<mmdd>.LOG |
<User ID>_PSDSTSRV.tracesql |
|
PSAESRV |
PeopleSoft Application Engine Server |
AESRV_<mmdd>.LOG |
<User ID>_PSAESRV.tracesql |
|
PSAEOSRV |
PeopleSoft Application Engine Server to run Analytic Engine |
APPSRV_<mmdd>.LOG |
<User_ID>_PSAEOSRV.tracesql |
|
PSANALYTICSRV |
Analytic Engine Server |
OPTENGS<server number>.LOG |
<User_ID>_PSANALYTICSRV <server number>.tracesql |
|
PSMSTPRCS |
Master Scheduler Server |
MSTRSCHDLR_<mmdd>.LOG |
<User ID>_PSMSTPRC.tracesql |
<User_ID> is the user ID that is specified in the PeopleSoft Process Scheduler configuration file that is set to boot PeopleSoft Process Scheduler.
Log and SQL Trace File Name in OS390 USS
The following table lists all the server names, log files, and SQL trace files in OS390 USS
|
Server Name |
Description |
Log File |
SQL Trace File |
|---|---|---|---|
|
PSPRCSRV |
PeopleSoft Process Scheduler Server |
PSPRCSRV_<Process Scheduler Server>_<mmdd>.log |
psprcsrv.trc |
|
PSDSTSRV |
Distribution Agent |
PSDSTSRV_<Process Scheduler Server>_<mmdd>.log |
psdstsrv.trc |
<Process Scheduler Server> is the name of the server that is defined in the server definition (that is, PSOS390).
At midnight, a new log file is created to contain information for the current MMDD value.
SQL Trace File
The SQL trace file is created when the TraceSQL variable in the PeopleSoft Process Scheduler configuration file has a value other than zero. This file contains the SQL traces that are issued by the Distribution Agent program PSDSTSRV.
Use the TraceSQL variable to set the level of SQL trace by selecting the numerical value representing each degree of tracing as described. The list of trace levels from which you can choose appears in the configuration file as shown:
1=SQL Statements
2=SQL statment variables
4=SQL connect, disconnect, commit and rollback
8=Row Fetch (indicates that it occurred, not data)
16=All other API calls except ssb
32=Set Select Buffers (identifies that attributes of columns
		to be selected)
64=Database API specific calls
128=COBOL statement timings
1024=SQL Informational Trace
4096=Manager information
8192=Mapcore information
If you want SQL Statements, SQL statement variables, and SQL connect, disconnect, commit, and rollback information, specify TraceSql=7 (1+ 2 + 4).
Note: The SQL trace file doesn’t delete existing traces that are written from prior runs of the PSPRCSRV program, and it appends new SQL activity to the end of the file. Because the file can grow quite large and might fill up your file server, you should reset the TraceSQL to zero after you finish debugging the PeopleSoft Process Scheduler Server Agent.
The logging system enables you to change the level of detail that is written to the log files. The mechanism that is chosen here uses the concept of a detail level and a fence. Messages are assigned a numeric detail-level value that reflects the importance of the event that triggers the message in the operation of the program. This ranges from simple progress messages (very detailed) to error messages when the program is about to terminate (not detailed).
The fence is used to filter out messages that reflect more detail than necessary in a particular installation. For example, a message must be able to leap the fence to be shown (with a lower number indicating a higher fence). With the fence set to 2, only messages with a detail level that is less than 2 (that is, 0 or 1) appear. The only exception to this is that level 0 messages and messages that are unable to be displayed in the standard message format cannot be filtered out.
The meaning of a level is completely arbitrary, although a consistent convention should be followed. The server uses the following convention:
|
Fence Level |
Description |
|---|---|
|
0 |
Errors, critical messages, and connection header only. |
|
1 |
Critical events. For PeopleSoft Process Scheduler, this includes process start attempts. |
|
2 |
Warnings. |
|
3 |
Informational. This is the default fence value. |
|
4 |
Trace level 1 detail. |
|
5 |
Trace level 2 detail. This shows all messages that are available. |
The fence is determined by an entry in the server configuration file in the [Process Scheduler] section named LOGFENCE. Normal values are in the range of 0−5, with the default being 3 (informational). A setting of 5 is recommended for installation and troubleshooting. A setting of 0 is good for an installed system that is working smoothly.
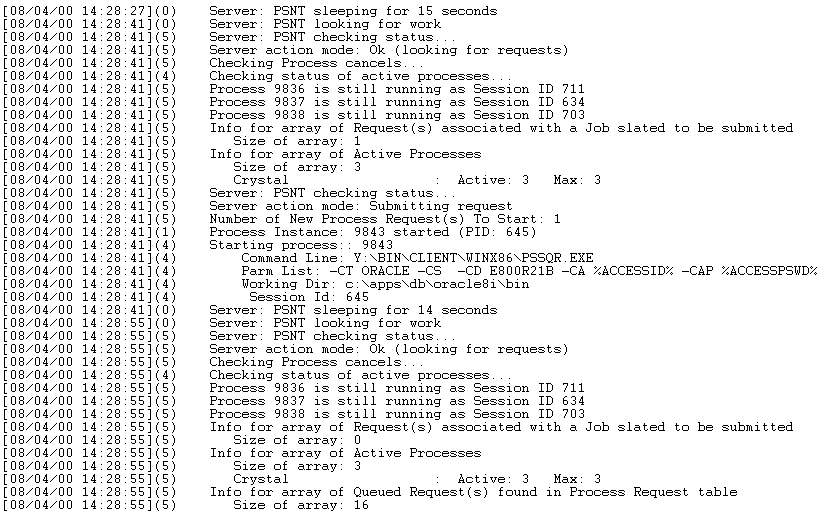
The log fence of a message can be seen in the PeopleSoft Process Scheduler log file.
Image: Example of log file
This example shows the numeric values enclosed in parentheses following the date and time
If you receive error messages, complete the following tasks to enable debugging and tracing:
Set LOGFENCE=5 in the psprcs.cfg file.
Set TraceSQL to the appropriate value to generate the SQL trace.