Viewing the Status of Servers
This section discusses how to view status of the servers.
To access the Server List page, select
Image: Process Monitor - Server List page
This example illustrates the fields and controls on the Process Monitor - Server List page. You can find definitions for the fields and controls later on this page.

|
Field or Control |
Definition |
|---|---|
| Server |
Displays the system name that identifies the server. Click to view activity details for the selected server. |
| Hostname |
Displays the name of server on which the PeopleSoft Process Scheduler Server Agent was started. |
| Last Update Date/Time |
Displays the last time that you refreshed the server list to display the most current information. |
| Dist Node (distribution node) |
Displays the name of the report node where the Distribution Agent posted all generated reports, logs, or trace files. |
| Master |
Displays Y if this server is designated as a Master Scheduler. |
| CPU (%) |
Displays current CPU usage as a percentage of the total. |
| Memory (%) |
Displays current memory usage as a percentage of the total. |
| Active |
Displays the number of processes that are currently in an active state of processing. |
| Status |
Status of the server. Values are Running, Down, and Suspended. A complete list of Status values appears later in this section. |
| Details |
Click to display detailed information about the selected server agent. |
| Refresh |
Click to display the most current status of a server. |
Server Status
The Status column on the Server List page indicates the current state of a PeopleSoft Process Scheduler server. Knowing the status of a server helps you identify a problem if the server has an error. This table describes each server status:
|
Status |
Description |
|---|---|
|
Running |
Server is active and querying the process request for any queued request to schedule. |
|
Running With No Report Node |
The server has not been assigned a report node in the server definition, so reports with output destination of Web will remain in posting status until a report node is specified. Note: Server is active and querying the process request for any queued request to schedule. |
|
Down |
Server was shut down. |
|
Suspended - Disk Low |
Server determined that the current Log/Output directory is below the disk threshold specified in the Process Scheduler configuration file. The server will not schedule new requests until space becomes available. |
|
Suspended - Offline |
Server is suspended because current day and time is not within the allowed operation times defined in the server definition. |
|
Overload |
The amount of CPU or memory used exceeds the percentage value thresholds entered. The server will wait to launch any new processes. |
See Defining Servers.
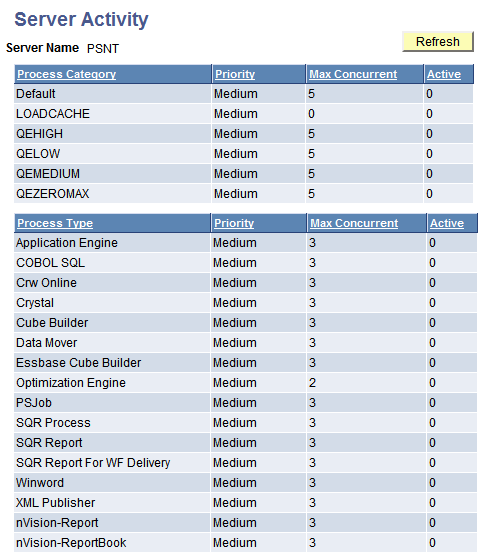
To access the Server Activity page, click the name of a server on the Server List page.
Image: Server Activity page
This example illustrates the fields and controls on the Server Activity page.

Use this page to view the following server activity information by process type and by process category:
Priority
Max. Concurrent
Active
Click the Refresh button to refresh the information. Click Return to return to the Server List page.
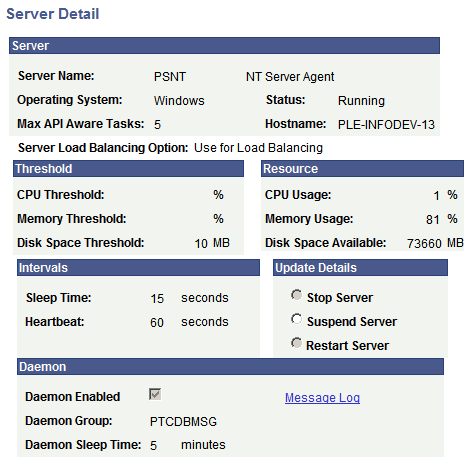
To access the Server Detail page, click the Details link on the Server List page.
Image: Server Detail page
This example illustrates the fields and controls on the Server Detail page. You can find definitions for the fields and controls later on this page.

Server
|
Field or Control |
Definition |
|---|---|
| Server Name |
Displays the name of the server on which this process runs. |
| Operating System |
Displays the name of the operating system of the server. |
| Status |
Displays the current status of the server: Running, Down or Suspended. |
| Max API Aware Tasks (maximum application programming interface aware tasks) |
Displays the number of concurrent processes that can run on this PeopleSoft Process Scheduler Server. |
| Hostname |
Displays the name of the server on which the PeopleSoft Process Scheduler Server Agent was started. |
| Server Load Balancing Option |
Displays the Server Load Balancing Option value selected for this server. |
Threshold
|
Field or Control |
Definition |
|---|---|
| CPU Threshold |
Displays the CPU threshold percentage value specified in the server definition. If CPU usage exceeds this value, the server will not schedule new requests until CPU usage drops below this amount. |
| Memory Threshold |
Displays the Memory threshold percentage value specified in the server definition. If memory usage exceeds this value, the server will not schedule new requests until memory availability drops below this amount. |
| Disk Space Threshold |
Displays the disk threshold specified in Process Scheduler configuration file. The server will not schedule new requests until space becomes available. |
Usage
|
Field or Control |
Definition |
|---|---|
| CPU Usage |
Displays current CPU usage. |
| Memory Usage |
Displays current memory usage. |
| Disk Space Available |
Displays the amount of disk space available. |
Intervals
|
Field or Control |
Definition |
|---|---|
| Sleep Time |
Displays the specified interval at which the PeopleSoft Process Scheduler Server Agent wakes up and polls the Process Request table. |
| Heartbeat |
Displays the value used by the PeopleSoft Process Scheduler Server Agent to track server status. Each time the server issues a heartbeat message, it updates the last date and time stamp in this table with the current date and time. This prevents the database from accepting more than one PeopleSoft Process Scheduler Server Agent with the same name. |
Update Details
|
Field or Control |
Definition |
|---|---|
| Stop Server (OS390 only) |
Select to shut down a PeopleSoft Process Scheduler Server that is running or exhibiting problematic behavior. |
| Suspend Server |
Select to prevent a running PeopleSoft Process Scheduler Server from accepting new process requests. |
| Restart Server |
Select to restart a PeopleSoft Process Scheduler Server that has been suspended. If a server has been stopped, you must restart it using PSADMIN. |
Note: After selecting one of these options, you must click OK to run the command.
Daemon
|
Field or Control |
Definition |
|---|---|
| Daemon Enabled, Daemon Group, and Daemon Sleep Time |
Displays the selections specified in the server definition. |
| Message Log |
Click to go to the Message Log page. A Delete button is located on this page, but it remains hidden when the daemon is running. When the Delete button appears, click it to delete all the messages in the log. |