Setting Up Kibana in PeopleSoft Search Framework
Before you can begin to set up Kibana for use in Search Framework, you should complete some prerequisites, such as the installation of PeopleTools 8.57 and Elasticsearch 6.1.2.
To set up Kibana to provide data on Search Framework and Elasticsearch, you need to complete the following steps:
Install Kibana.
Connect Kibana to the Elasticsearch server.
Start Kibana service.
Note: These instructions assume that PeopleTools 8.57 and Elasticsearch 6.1.2 are installed in your environment.
Installing Kibana
Search Framework supports the installation of Kibana on all platforms that are certified by PeopleSoft for Elasticsearch.
To install Kibana, you use the delivered Elasticsearch DPK. For instructions on installing Kibana, refer to the PeopleSoft Deployment Packages for Elasticsearch Installation (Doc ID 2205540.2) on My Oracle Support.
Kibana is a Web-application, and you can install it on the same server where Elasticsearch is installed or you can install it on a separate server.
Connecting Kibana to Elasticsearch
When you use the Elasticsearch DPK to install Kibana, the installation script prompts you to specify the Elasticsearch server that you want to connect to Kibana. You can connect to the Elasticsearch server that you are in the process of installing, or enter the credentials for a different Elasticsearch server.
After installing Kibana, you should manually set up the connection between the Elasticsearch search instance in PeopleSoft and the Kibana monitoring server using the Elasticsearch Monitoring Server page. For instructions on using the Elasticsearch Monitoring Server page, see Using the Elasticsearch Monitoring Server Page.
When you are using an Elasticsearch cluster with three nodes, Kibana is connected to only one node of the cluster. The system monitoring job that keeps track of the cluster statistics is activated in the first node provided in the search instance configuration. If there is a change in the primary node in the search instance, it is necessary to stop the monitoring job and then start the monitoring job by using the system monitoring flag on the Elasticsearch Monitoring Server page.
For Kibana to be always available, you should ensure that the Elasticsearch server it connects to is always up and running.
Starting the Kibana Service
On the Windows platform, after you install Kibana, you need to start the Kibana service. Refer to the PeopleSoft Deployment Packages for Elasticsearch Installation (Doc ID 2205540.2) on My Oracle Support.
To start Kibana on Windows, perform the following steps:
Open a command prompt, and change directory to Kibana_Home\bin.
Run kibana.bat.
When the service status displays as Listening, you can access the Kibana service in a browser using the URL displayed in the command prompt.
The default port for Kibana is 5601, but you can change it by modifying the value in the kibana.yml configuration file.
http://example.com:5601The Kibana URL prompts you for an user name and password. You must enter the Elasticsearch administrator user name, that is, esadmin and the password, which you entered while installing Elasticsearch.
On the Linux platform, after you install Kibana, the Kibana service is automatically started. If the Kibana service is not started, you can start the service by running kibana.sh
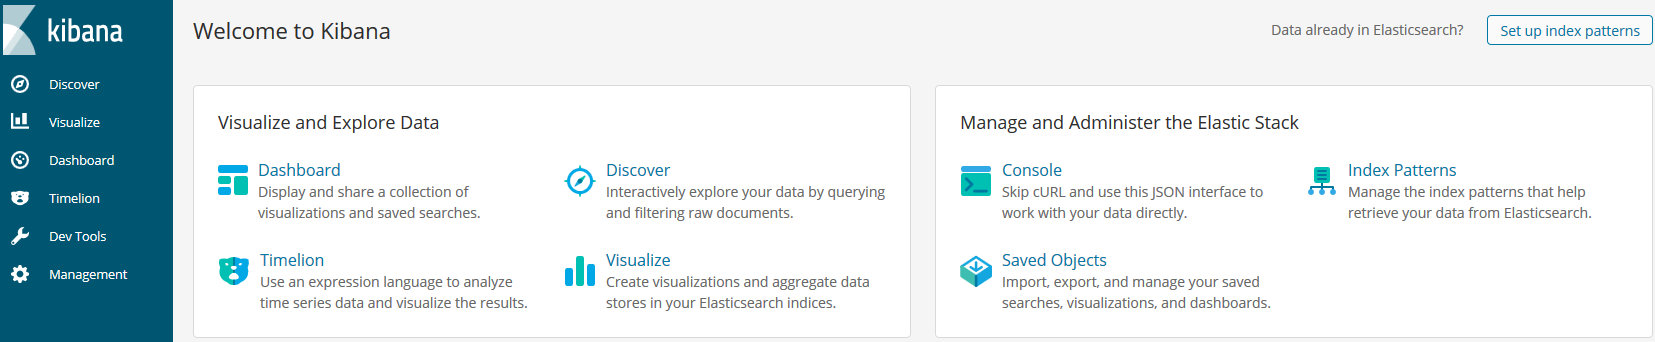
An example of the Kibana home page:
Image: Kibana home page
This example illustrates the Kibana home page which you access using the URL.
Use the Elasticsearch Monitoring Server page to establish a connection between Kibana and the Elasticsearch server where you want to index the system and indexing metrics.
Access the Elasticsearch Monitoring Server page by selecting .
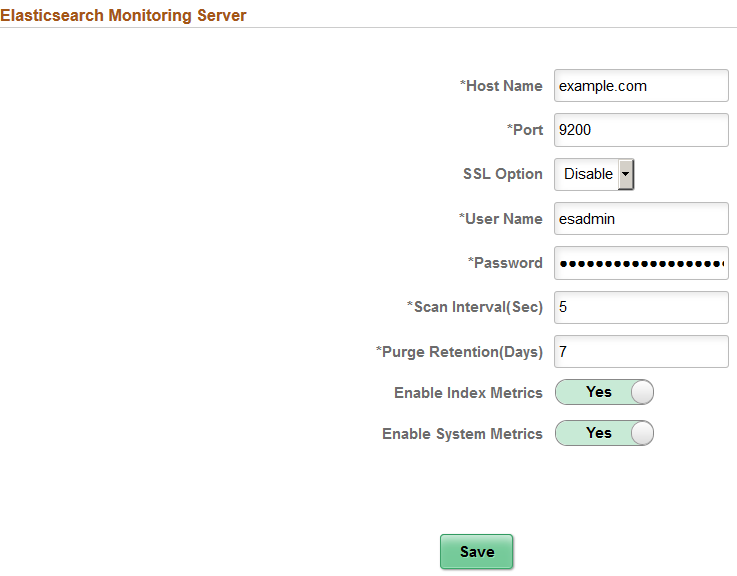
Image: Elasticsearch Monitoring Server page
This example illustrates the fields and controls on the Elasticsearch Monitoring Server page. You can find definitions for the fields and controls later on this page.
|
Field or Control |
Definition |
|---|---|
| Host Name |
Enter the Elasticsearch server where you want to index the system and indexing metrics. Note: This should be the Elasticsearch server mapped to Kibana during installation of Kibana. You can use the same Elasticsearch server where the application data is indexed or you can use a standalone server for the sole purpose of metric analysis. You can also specify the server in the kibana.yml file. |
| Port |
Enter the Elasticsearch server port that you specified during installation of Elasticsearch. |
| SSL Option |
Select an option based on whether SSL is enabled or disabled on the Elasticsearch server. The default is Disable. |
| User Name |
Enter the user ID for the Elasticsearch admin user. The default is esadmin. |
| Password |
Enter the password associated with the user name. |
| Scan Interval(Seconds) |
Specify the time interval (in seconds) when system metrics will be retrieved from the Elasticsearch server. For example, if you enter 10, system metrics will be retrieved every 10 seconds. |
| Purge Retention Period(Days) |
Specify the number of days to store the system and indexing metrics. For example, if you enter 7, the metrics data will be retained for 7 day. |
| Enable Index Metrics |
Select Yes if you want indexing metrics to be collected for viewing and analyzing in the Indexing Metrics dashboard. The default is No. When you set it to Yes, the indexing metrics are sent to the configured server. PeopleSoft Search Framework delivers the following index for indexing metrics: ptsf_es_index_metric_yyyy_mm, where yyyy and mm indicates the year and month of the indexed data. The naming convention of the index ensures that the files do not grow too large over a period of time and also ensures that you can easily clean up the index files, if required. |
| Enable System Metrics |
Select Yes if you want system metrics to be collected for viewing and analyzing in the System Metrics dashboard. The default is No. When you set it to Yes, the orcl-monitor-plugin starts indexing the system metrics data of the Elasticsearch server, which is configured as the primary search server on the Search Instance page. PeopleSoft Search Framework delivers the following index for system metrics: ptsf_es_system_metric_yyyy_mm, where yyyy and mm indicates the year and month of the indexed data. The naming convention of the index ensures that the files do not grow too large over a period of time and also ensures that you can easily clean up the index files, if required. |
| Save |
When you select Save:
Note: To save the configurations, the Elasticsearch server must be a running instance of Elasticsearch. |