Using Dashboards and Visualizations in Kibana
In PeopleTools 8.57, PeopleSoft Search Framework delivers three dashboards and each dashboard displays several visualizations that provide you real-time data as well as historical data. These visualizations enable you to analyze data and act upon any errors if any. For example, you can use the historical data to view the indexing process and analyze any failed transaction and rectify it, if needed.
This topic aims to provide you information on the dashboards that are delivered by PeopleSoft Search Framework. For information on the other capabilities of Kibana, such as building dashboards, using Discover, using Visualize, etc., refer to the Kibana User Guide [6.1], which is available on www.elastic.co.
In Kibana, a dashboard is a collection of visualizations and searches. A visualization is based on Elasticsearch queries on the Elasticsearch data. These visualizations are in the forms of charts, maps, tables, etc. PeopleSoft Search Framework delivers three dashboards, and each of the dashboards display two or more visualizations. For a list of delivered dashboards and visualizations, see Delivered Dashboards and Visualizations.
You may build dashboards based on your business requirements. For instructions on building dashboards, refer to the Kibana User Guide [6.1], Dashboard, Building a Dashboard, which is available on www.elastic.co.
In PeopleTools 8.57, PeopleSoft Search Framework delivers the following dashboards and visualizations.
Note: Oracle recommends that you do not edit or delete the delivered dashboards and visualizations.
Indexing Metrics dashboard —provides statistics of the transactions and segments— and displays the following visualizations:
Transaction Status
Transaction/Segment Count
Segment History
Transaction History
Indexing Summary —provides data of the indexing count and time taken for indexing— and displays the following visualizations:
IndexCount/Process
IndexTime/Process
Index Count
System Metrics —provides an overview of the health of the system— and displays the following visualizations:
CPU (%) Utilization
Disk Space Utilization
JVM (%) Utilization
Total Indexed Documents
This topic discusses some of the common elements on the visualization. For more information on the other elements on the Kibana visualizations, refer to the Kibana User Guide [6.1], which is available on www.elastic.co.
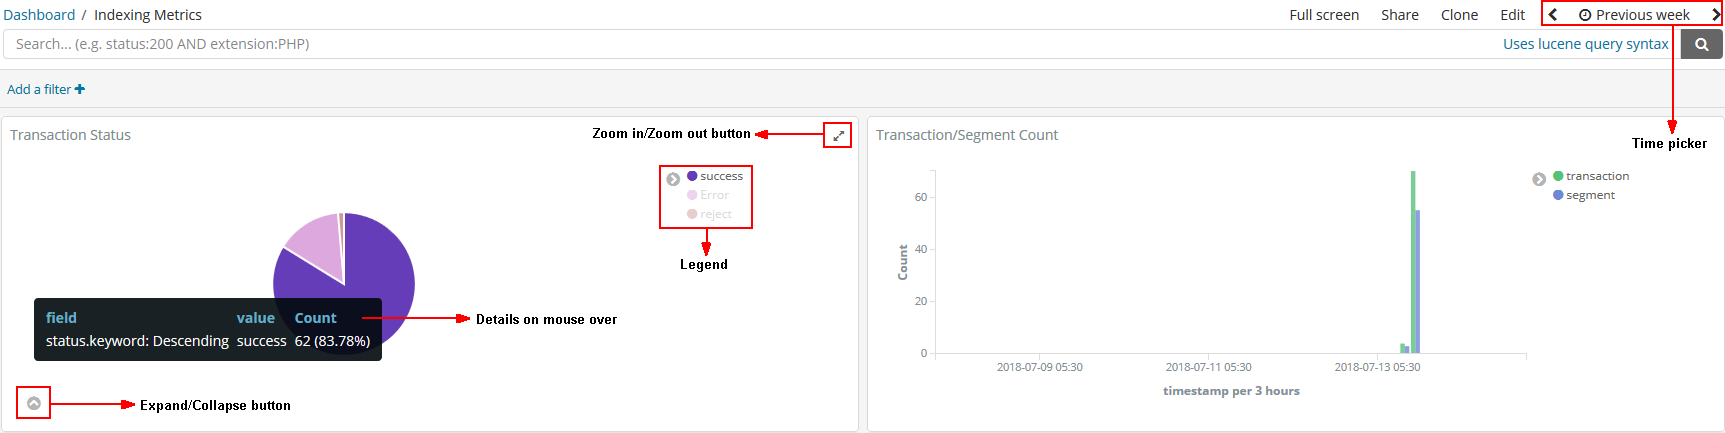
Image: Common Elements on Visualizations
This example illustrates the common elements on Visualizations. You can find definitions for these common elements later on this page.
|
Field or Control |
Definition |
|---|---|
| Time Picker |
Use the Time Picker area to restrict the search results to a specific time period. The time picker enables you to set the filter to view real time data and historical data. For more information on time picker, refer to Kibana User Guide [6.1], Discover, Setting the Time Filter. |
| Zoom in/Zoom out button |
Use the Zoom out button to enlarge the selected visualization. |
| Legend |
Kibana randomly uses different colors in a legend. You can collapse the legend if you want more real estate on the selected visualization. |
| Details on mouse over |
Hover the mouse over a chart to view details of the slice or bar. |
| Expand/Collapse button |
Use the Expand button to display the raw data behind a visualization. It also enables you to see the raw request sent to the Elasticsearch server, and the raw response from the server. For more information, refer to Kibana User Guide [6.1], Visualize, Visualization Spy; Dashboard, Viewing Visualization Data. |
Access the Indexing Metrics dashboard by selecting Dashboard, and then selecting Indexing Metrics from the list of dashboards.
The Indexing Metrics dashboard provides statistics on the transactions and segments during indexing.
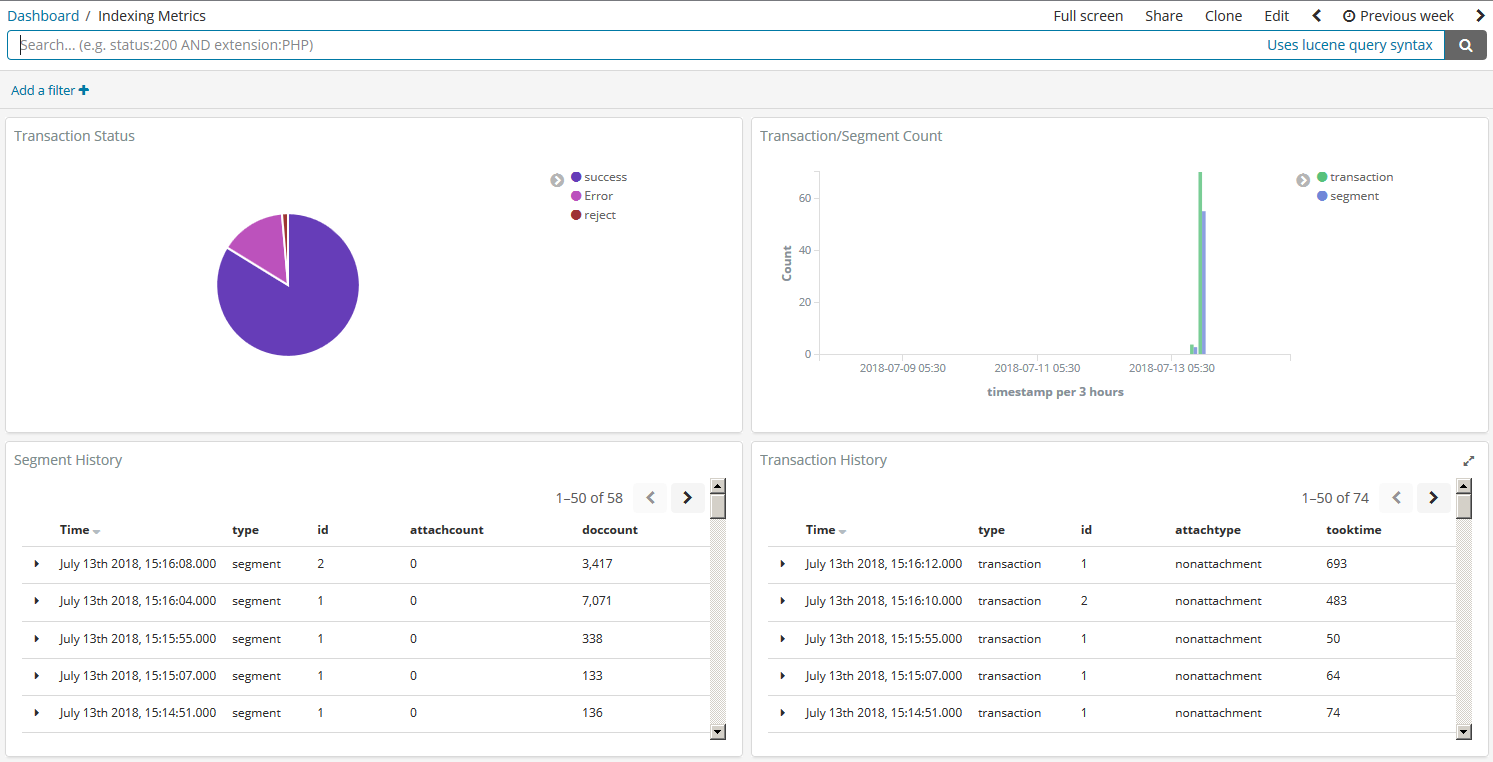
Image: Indexing Metrics dashboard
This example illustrates the visualizations on the Indexing Metrics dashboard. You can find definitions for the visualizations later on this page.
|
Field or Control |
Definition |
|---|---|
| Transaction Status |
Displays the status of transactions as a pie-chart. The transaction statuses are:
Selecting any of the slices from the pie-chart enables you to view only the transactions in the selected status in the Transaction Status visualization and the Transaction History visualization displays only the transactions of the selected status, thus enabling you to drill down to each transaction and view details of the transaction, such as process instance, index name, etc. For example, to drill down to the transactions that are in Error status and to understand why the transaction is in Error status, you can perform the following steps:
|
| Transaction/Segment Count |
Displays the count of transactions and segment at a specific time period in the form of a vertical bar chart. |
| Segment History |
Displays the segment history and includes the attachment count and document count in each segment. |
| Transaction History |
Displays the transaction history and includes the attachment type (attachment or non attachment) in each transaction and the time taken for each transaction. |
Access the Indexing Summary dashboard by selecting Dashboard, and then selecting Indexing Summary from the list of dashboards.
The Indexing Summary provides data on the indexing count and time taken for indexing.
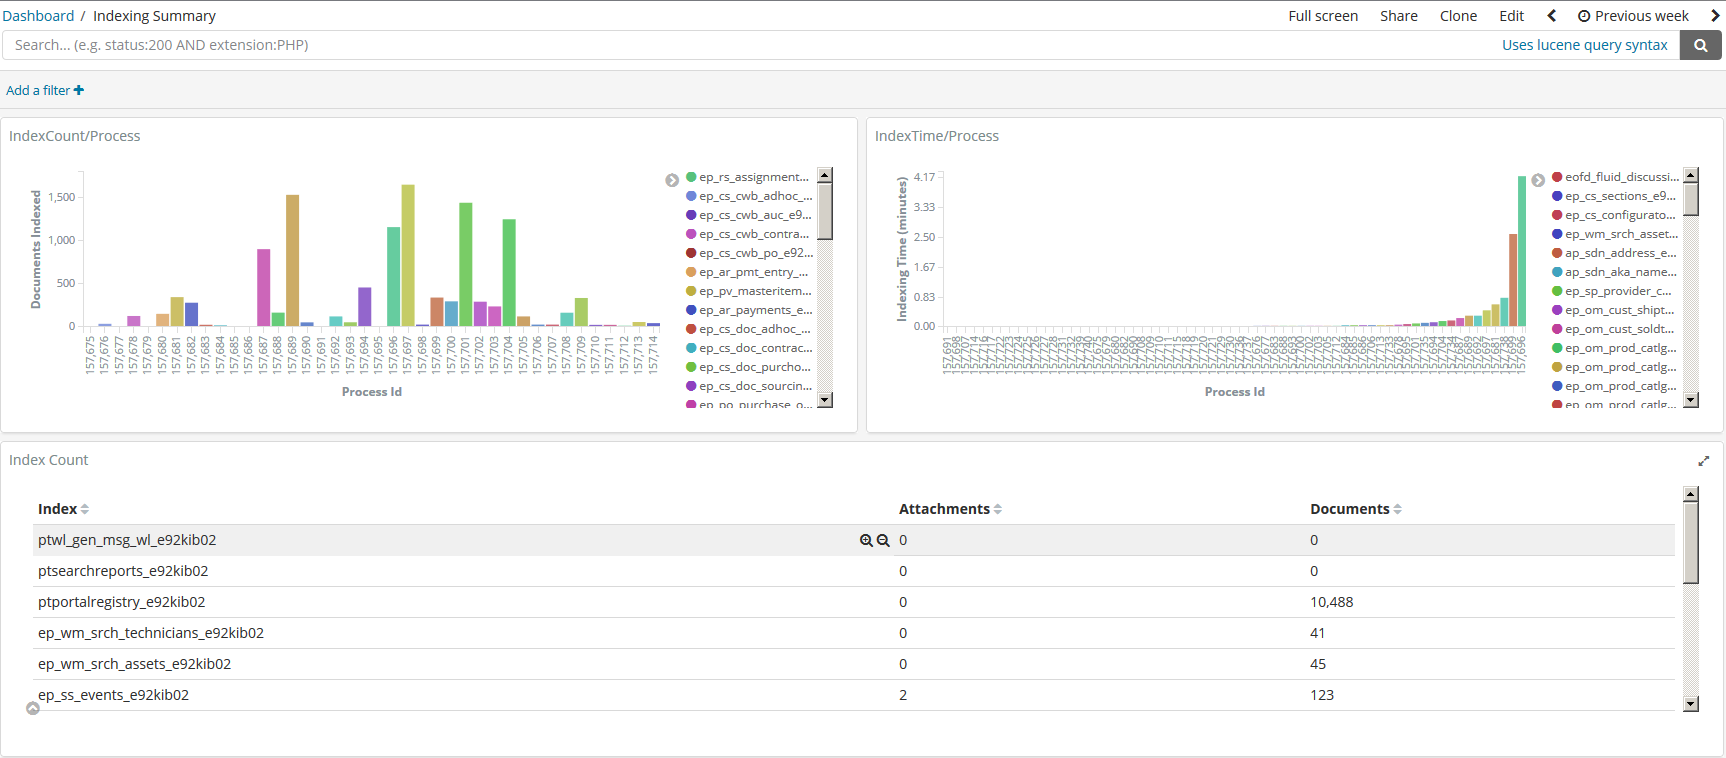
Image: Indexing Summary dashboard
This example illustrates the visualizations on the Indexing Summary dashboard. You can find definitions for these visualizations later on this page.
|
Field or Control |
Definition |
|---|---|
| IndexCount/Process |
Displays the documents indexed for an index and the process instance ID as a vertical bar chart. If you want to view a particular index, you can use the Search area (at the top of the page) to enter the index name. For example, if you want to obtain information on the ep_ap_payments index, you enter indexname:ep_ap_payments*. |
| IndexTime/Process |
Displays the time taken for indexing documents for each index and the process instance ID as a vertical bar chart. If the document count is low, but the time taken is considerably high, then you should correlate with the System Metrics dashboard to observe whether the system was unstable. |
| Index Count |
Displays the count of attachments and documents for each index in a tabular format. |
Access the System Metrics dashboard by selecting Dashboard, and then selecting System Metrics from the list of dashboards.
The System Metrics dashboard provides an overview of the system health, that is, you can view the real-time health of the system and also view the health of the system over a specific period of time in the past.
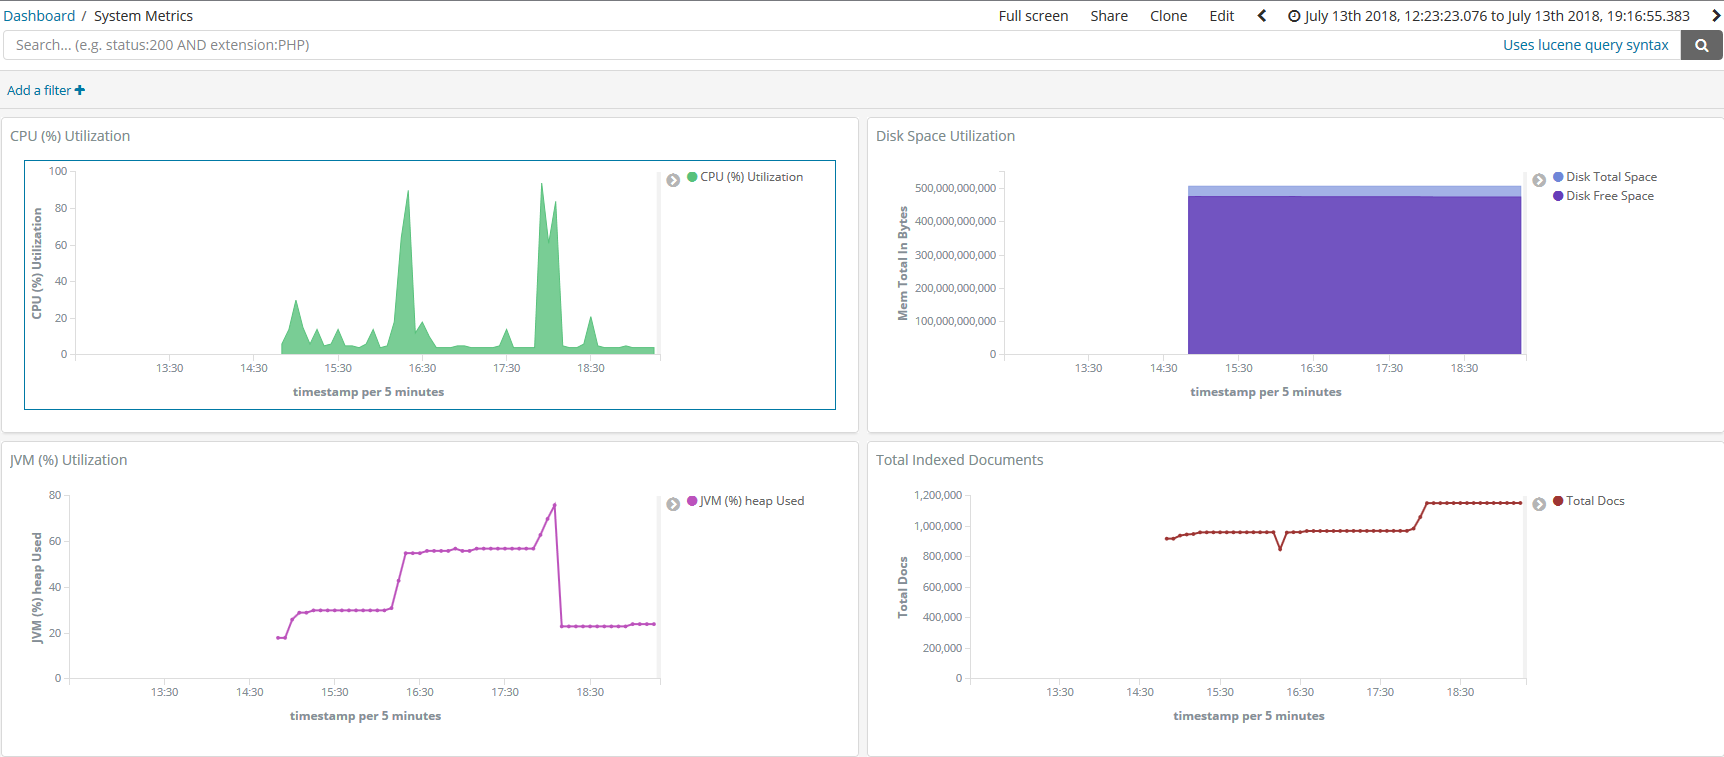
Image: System Metrics dashboard
This example illustrates the visualizations on the System Metrics dashboard. You can find definitions for the visualizations later on this page.
|
Field or Control |
Definition |
|---|---|
| CPU (%) Utilization |
Displays the CPU utilization over a specific period of time by the Elasticsearch server in the form of an area chart. |
| Disk Space Utilization |
Displays the total disk space and the free space available for use in the form of an area chart. The total memory is displayed in bytes. |
| JVM (%) Utilization |
Displays the total JVM percent used by the Elasticsearch server in the form of a vertical bar chart. |
| Total Indexed Documents |
Displays the total number of indexed documents over a specific period of time in the form of a line chart. |