High-Level Overview and Flow Diagram for PeopleSoft Pivot Grid
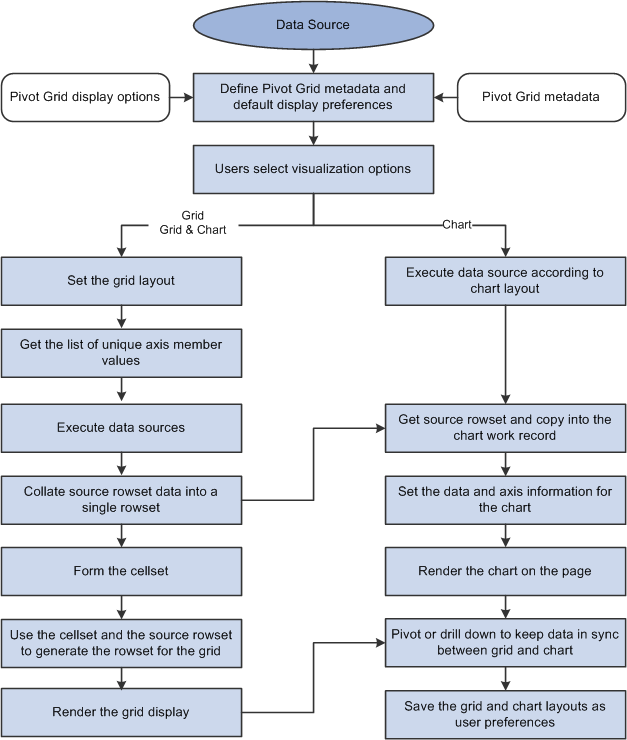
PeopleSoft Pivot Grid provides the overall functionality of storing Pivot Grid metadata, generating data sources at runtime, and rendering displays of the pivot grid and chart. Pivot Grid uses PSQuery, Composite Query, and component as the data source, with Pivot Grids and PeopleSoft charts as the visualization options. Pivot Grid can pivot and filter data, which enables business analysts to see different views of the same data. PeopleSoft charts provide a different visual representation of the same data. If users select the display option Pivot Grid and Chart, the chart data is always a subset of the data in the grid, and the synchronization between the grid and the chart is unidirectional only. Users' actions on the grid change the chart visualization as well.
Image: High-level flow diagram for PeopleSoft Pivot Grid
This diagram illustrates the high-level flow for PeopleSoft Pivot Grid.
When using Pivot Grid, note that:
PeopleSoft Pivot Grid supports PSQuery, Composite Query, and component as the data source.
All user actions on the Pivot Grid grid and the chart are driven through the settings in PSQuery, Composite Query, and component. No data is cached for viewing. Every user action that requires fresh data results in a new set of the modifications in PSQuery and Composite Query at runtime, and the ad hoc set of modified data source is run against the database to fetch data.
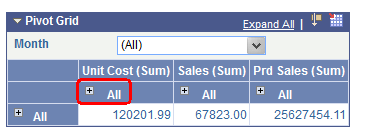
Supported aggregate functions—MAX, MIN, COUNT, COUNT DISTINCT, AVG, and SUM—are computed at the database level, and the results appear in grids and charts. In addition, an All (Total) attribute can be defined for axis members that calculates subtotals based on the aggregate function defined for the Values.
Note: Only a single level of subtotal (that is, the innermost level) is supported in PeopleSoft Pivot Grid.
Image: Example of supporting subtotal for the axis immediately above the innermost Value
If the Values are at the innermost level, then subtotal is also supported for the axis immediately above the innermost Value level, as shown in this example.
If users select the Pivot Grid and Chart display option, then the filtering operation in the grid (changing the report filter values) filters on the chart as well.
If an All attribute is defined for the axis members, then a drill-down operation on the grid indicates the user's action of clicking the + (plus) icon associated with the label.
If users select the Pivot Grid and Chart display option, then the drill-down operation on the grid drills down on the chart as well.
If users select the Chart Only display option, then the drill-down operation for a chart indicates the user's action of clicking the chart to display a detailed level of data.
To drill down on the Pivot Grid charts, you must enter an authentication domain either when you set up the PeopleSoft Pure Internet Architecture or in the Web Profile page.
See the Configuring General Portal Properties section in Configuring Web Profiles.
Pivot Grid supports all PeopleSoft chart types that are related to bar, pie, line, and horizontal charts.
Pivot Grid assigns one field from the Grid Row Axis to the X axis and one field from the column axis to the Y axis of the chart. In addition, you can select an overlay field and a data series (to display one level of drill down) for the chart.
Note: If the display option is Chart Only, you are able to select the series and overlay values for the charts. If the display option is Pivot Grid and Chart, series values are automatically calculated based on the grid layout, but overlay is not supported.
For example, a query was built on a record that stores the number of product units sold and product sales for a set of regions and products by month:
Unit Cost
Product Sales
Region (Key)
Product (Key)
Month (Key)
No. of Units Sold
-
-
-
-
-
-
If Region were selected on the X axis and Product Sales were selected on the Y axis, then a user could select No. of Units Sold as an overlay field.
If No. of Units Sold were selected as an overlay field, then two separate charts would be plotted, one chart with Product Sales on the Y axis and the other with No. of Units Sold on the Y axis. One chart would be superimposed over the other chart. For overlay fields, the supported chart type is Line Chart.
If Product were selected as a data series, then the chart would group the sales for each product for each region and then plot the data.
The synchronization between the chart and the grid is unidirectional and is always driven by a user action on the grid.
To support unidirectional synchronization between a chart and a grid, which is always driven by an action performed on the grid, the data in the chart must always be a subset of the data shown in the grid.
Logging is available; by enabling the log application, developers or customer developers can analyze errors or debug any products they build using this technology.