Pivot Grid Components
Pivot Grid has four main components:
Pivot Grid Data Source Engine component.
This component is the back-end component of Pivot Grid. It provides the necessary framework support for runtime manipulation and generation of data sources to render the grid and chart display. This component also provides interfaces that can be used by the Pivot Grid User Interface component, the Grid-display component, and the Chart-display component to perform the required data source manipulations for rendering the controls on the Pure Internet Architecture page.
Pivot Grid User Interface component.
You use this component to create and update Pivot Grid models using the Pivot Grid wizard, to view the Pivot Grid models in the Pivot Grid Viewer, and to create different views for the same Pivot Grid model.
Grid-display component.
This component is primarily responsible for rendering data in the Pivot Grid grids. Its functionality understands the current grid layout and invokes the interfaces of the Data Source Engine component to execute data sources. It also interprets various actions in the grid and subsequently invokes the engine component for executing the data source again.
Chart-display component.
This component is primarily responsible for rendering data in the Pivot Grid chart. Its functionality understands the current chart layout and invokes the interfaces of the Data Source Engine component to execute data sources. It also interprets various actions in the chart and subsequently invokes the engine component for executing the data sources again.
The Pivot Grid Data Source Engine component is responsible for runtime data source manipulation to retrieve the data required for a grid and chart. Any events in the grid and chart will result in a data source modification and it being rerun, which are handled by the data source engine. The Pivot Grid Data Source Engine component enables you to:
Set Pivot Grid metadata.
Pivot Grid metadata includes axis members, Value members, total attribute, total name, column label, tree name, tree node, aggregate functions for Value members, and Pivot Grid viewing options.
Retrieve Pivot Grid metadata from the database.
Return a result set for a chart, a result set for a grid, unique values for axis members, unique values for filters, and drill-down values for detailed view.
The Pivot Grid User Interface component enables you to create new Pivot Grid models and to update existing Pivot Grid models. This component is a step-by-step wizard with a user-friendly mechanism for creating and updating Pivot Grid models. The last step of the wizard enables you to preview the models that you created.
You can define two parts of a Pivot Grid model using the Pivot Grid User Interface component:
Pivot Grid core.
Based on the definitions in data sources, this core defines which columns and aggregation functions are used and which totals and subtotals appear. You cannot change the Pivot Grid core at runtime.
Pivot Grid model default view options.
This part displays the Pivot Grid model and defines the default values for the runtime prompts that are associated with data source, grid and chart axis information, grid and chart display preferences, and so on. One set of default view options is associated with the Pivot Grid model whenever it is created. These view options are the preferences used to render the display when the Pivot Grid appears initially. You can customize the display and save your personalizations for the Pivot Grid model. These preferences take precedence when the system displays a Pivot Grid model for you.
The Pivot Grid Grid-display component is based on the existing PeopleSoft analytic grid. This component enables users to leverage the different functionality of the analytic grid, like multi-level display and the drag and drop operation. However, unlike the analytic grid, the grid in a Pivot Grid does not require the analytic server to run; it can function as a standalone Pure Internet Architecture component. As with the analytic grid, the grid in a Pivot Grid has three axes—row, column, and filter. You can place the axis and value members on any of these axes to provide different views of the same data.
The Grid-display component provides the following functionality:
Uses the Pivot Grid Data Source Engine interfaces to execute the data source at runtime to render data in a grid. The grid does not cache any data. Any layout modification will result in a new data source execution to retrieve the data.
Note: Modifications in data sources are not saved; Pivot Grid executes data sources in an ad hoc way to retrieve information.
Responses to users' filtering, pivoting, and drill-down actions from within the grid. Each of these actions will result in the data source being modified and rerun to retrieve the rowsets again.
Exports the current slice of data visible in the grid to Microsoft Excel.
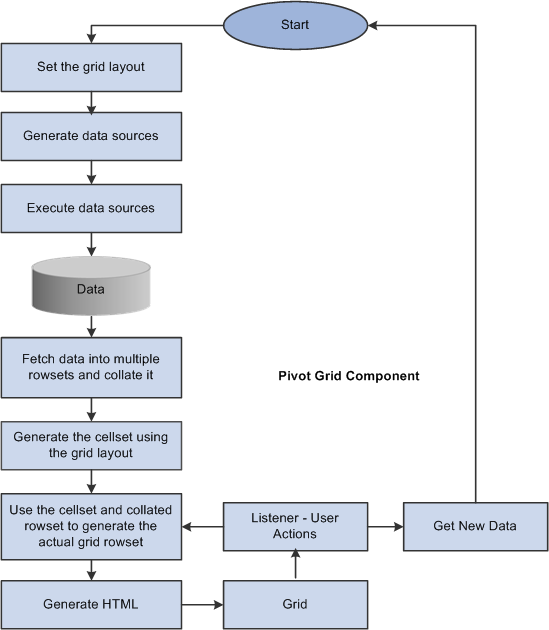
Image: Process flow of the Grid-display component
This diagram illustrates the process flow of the Grid-display component.
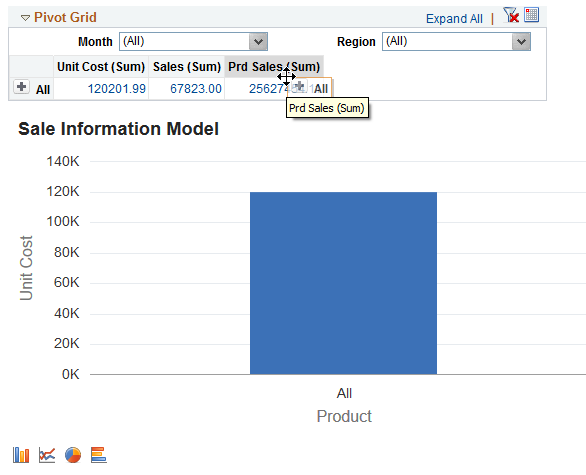
Note: While you are dragging and dropping values, a move icon with a visible label indicates axis and values that can be dragged, and the droppable locations are indicated with a grey background for labels.
Image: Visible Labels in Grid Display component
This example illustrates the axis value that is labeled Product and the drop zone that is labeled Unit Cost (Sum).
The Pivot Grid Chart-display component also uses the Pivot Grid Data Source Engine component to retrieve data from the source. It provides the following functionality:
Invokes the Pivot Grid Data Source Engine interfaces to modify the data source at runtime to retrieve data.
If the display option is Chart Only, a single data source modification and run suffices for retrieving the relevant charting data; extra modifications are required to get filter values. If the display option is Pivot Grid and Chart, Pivot Grid uses the result set that was retrieved when populating the grid for chart display.
Calls the appropriate PeopleCode charting APIs for generating and rendering the chart control on the page.
If the display option is Chart Only, users can drill down on the chart by clicking the data points of the chart to display details.
After drilling down, a drill-out option is available as a locator link at the top of the chart. Clicking the drill-out link restores the chart to its earlier state.
Note: The number of drill downs that can be performed on a chart-only view has no limitations. If you perform the fifth drill down, Pivot Grid resets the drill-down links and restarts from the first position.
All the pivoting, drilling down, and filtering operations on the grid result in an appropriate synchronization action on the chart if the display option is Pivot Grid and Chart.
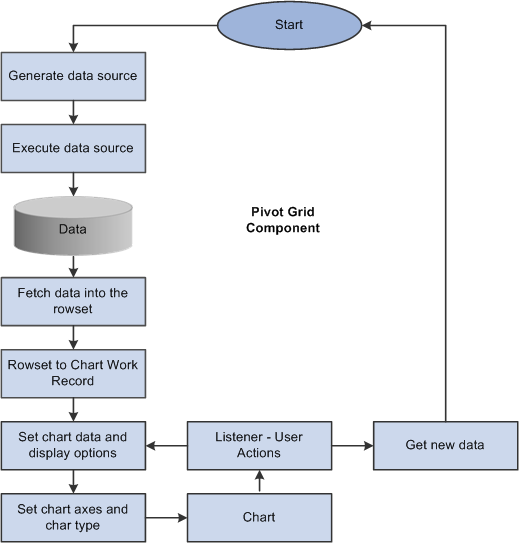
Image: Process flow of the Chart-display component
This diagram shows the processes of the Pivot Grid Chart-display component.