Understanding Types of Trees
This topic provides an overview of understanding types of trees.
In the most basic type of tree, the lowest level – that is, the level farthest to the right in the tree – holds detail values. The next level is made up of tree nodes that group together the detail values, and each subsequent level defines a higher-level grouping of the tree nodes. This kind of tree is called a detail tree.
In a detail tree, the lowest level in the hierarchy consists of the detail values, which are represented by leaves; (these trees are sometimes called summer trees.) You can use a detail tree to represent account hierarchies, product hierarchies, business unit hierarchies, and so on.
Detail trees are used most often for nVision reporting from the General Ledger.
Image: Example of detail tree
This example illustrates a detail tree.
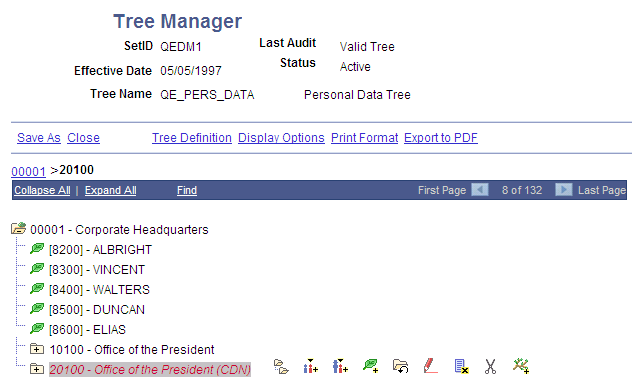
In this example, the Corporate Headquarters node is at the highest level and it has details such as Albright, Vincent, Walters, and so on. These details are at the lowest level of hierarchy and in this case denote individual employees in the Corporate Headquarters. Apart from details, this tree also has nodes such as Office of the President and Office of the President (CDN), which itself contains details.
In a normal detail tree, the detail values that fall under each node are defined by a specific value or range of values. With a dynamic detail tree, detail values are determined by matching the node name with a field on the detail value table. The system dynamically determines appropriate values from the detail value table at the time it uses the tree. Instead of specific or range of values, the detail values appear as blank on the PeopleSoft Tree Manager display.
Note: Do not create trees that contain a combination of dynamic details and range details if the tree is used by PeopleSoft Query or PeopleSoft nVision. Trees with this combination of details may yield incorrect reporting results when used with these reporting tools.
For dynamic detail trees, the parent node value defines part of the primary key for the detail values.
Image: Example of a dynamic detail tree
This example illustrates a dynamic detail tree.
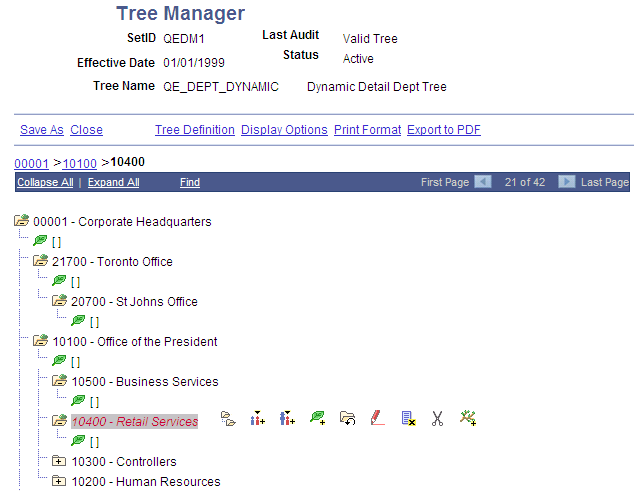
In the preceding illustration, each node represents a value of the DEPARTMENT_ID field. The structure of the tree determines the relationships between departments and their groups, so that your reports can roll up department data. Departments are not the lowest level of detail, though. Each department consists of employees, and when you assign a department cost, you assign it to a particular department and an employee. These two fields, DEPARTMENT_ID and EMPLID, are both key fields for the department data. So to capture these costs, the department tree needs to group the employees for each department. That is where the detail values come in.
The detail values in this tree represent values for EMPLID. Rather than listing each EMPLID value separately, however, you tell PeopleSoft Tree Manager to use all of the employees associated with the parent DEPARTMENT_ID. For example, if you ask for a report on the RETAIL SERVICES department, the system will roll up the data whose DEPARTMENT_ID is RETAIL SERVICES and whose EMPLID is any value.
You can select to display all detail values for a selected node or to display detail values based on the tree’s current effective date.
In standard detail trees, the detail values represent data values from a database field, and the tree nodes represent roll-up points for detail values. The nodes have no meaning outside the context of the tree. However, you can also create node-oriented trees.
Node-oriented trees are based on a detail structure, but the detail values are not used. For this type of tree, the tree nodes represent the data values from the database field. The system uses node-oriented trees for special purposes. For example, PeopleSoft HRMS applications use the Departmental Security tree to give users access to information only about employees in their departments.
Image: Example of node-oriented tree
This example illustrates a node-oriented tree.
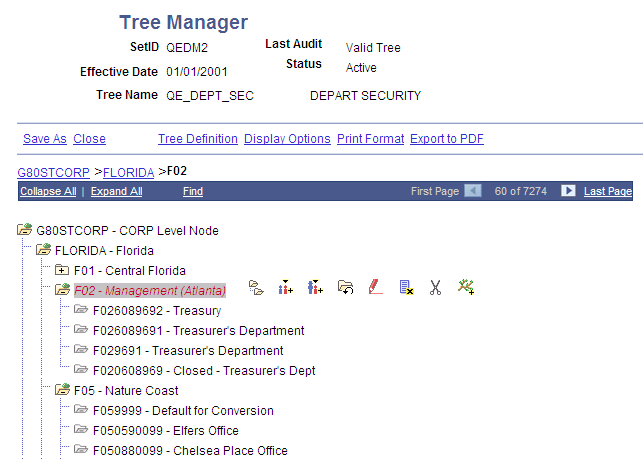
Note: In this example, Florida is a node at the top level which has subnodes of Central Florida, Atlanta, Nature Coast, and so on. These nodes in turn have nodes such as Treasury, Treasurers Department, and so on. None of the nodes have leaves.
Node-oriented trees have no leaves, and are sometimes called winter trees. Instead, each node is a possible value of the DEPTID field.
Summary trees are generally used for General Ledger reporting. A summary tree provides an alternative grouping of the nodes from a detail tree without duplicating its entire structure. In a summary tree, the detail values are tree nodes from an existing detail tree rather than values from a database field. The tree groups the nodes from a specific level in the detail tree differently from the way it groups the higher levels in the detail tree itself.
For example, suppose you want to roll up your departmental hierarchy differently for two reports. The first report shows the reporting structure, so you want to group your departments according to the division to which they report. The second report is a financial report, showing profit centers, overhead centers, and production centers. From the group level down, the two hierarchies are the same.
You have two options:
Create two complete detail trees that are identical from the group level down.
Create one complete detail tree, then create a summary tree whose detail values are the group-level nodes on the first tree.
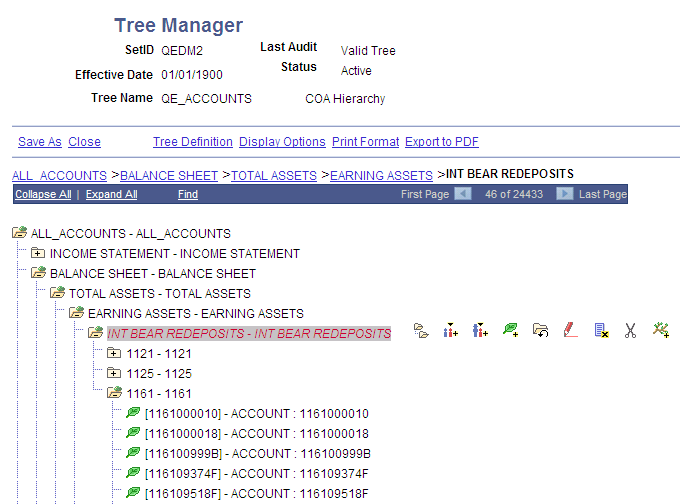
Image: Example of summary tree
This example illustrates a summary tree.
When you use a node from a summary tree in a report or summary ledger, the system refers back to the detail tree to determine which detail values report to that node. For example, suppose you want to report on production centers. You have created a summary tree that shows which groups are production centers, and you pick the Production Center node. The summary tree shows that the Engineering group and the Manufacturing group (among others) are production centers, but it does not show which departments are in these groups. The system uses the detail tree to determine the departments in the group.
Summary trees make it easier to maintain trees. If you change the lower part of the tree, you need to update only one tree.
The most common use of summary trees is to create summary ledgers in PeopleSoft Financial Data Management applications. You create summary trees based on your basic ChartFields to create alternative roll-ups. You create reports based on the various summary trees to view your financial data from a variety of perspectives.