OFSAA Rate Management is a comprehensive utility enabling you to manage currencies, yield curves, interest rates, and currency exchange rate data with a high degree of security and. OFSAA Rate Management also allows you to maintain economic forecasts such as GDP growth, inflation rates, or unemployment projections that can be linked to your models for interest rates, exchange rates, or new business growth.
Historical rate data obtained from OFSAA Rate Management is utilized by the Enterprise Performance Management (EPM) applications (OFS Funds Transfer Pricing, OFS Profitability Management, OFS Asset Liability Management, and OFS Balance Sheet Planning).
· Currency
The quality and availability of interest rate information vary throughout the world. In many markets, gathering comprehensive rate information is a challenge because of insufficient security types, inconsistent quoting conventions, and lack of liquidity. The Interest Rates module in OFSAA Rate Management allows you to define and manage complex yield curve definitions using multiple rate formats and other rate attributes to give you data storage capabilities appropriate to your market. The Interest Rates module also supports the creation and maintenance of historical rate data for each yield curve you define.
Historical interest rate data from OFSAA Rate Management is utilized in OFSAA Transfer Pricing to generate transfer rates and option costs. Historical interest rate data is also utilized in OFSAA Asset Liability Management and OFSAA Balance Sheet Planning to generate forecasted interest rate scenarios.
To view the Interest Rate Code Summary page, navigate to Common Object Maintenance and select Rate Management, and then select Interest Rates.
Figure 1: Interest Rate Summary Page
Description of Interest Rate Summary Page as follows
A Search pane is provided to search for interest rate curves using Code, Name, Currency, Rate Format, or Curve Type parameters.
To search the Interest Rate, follow these steps:
1. Enter the search criteria and click Search.
2. Click Reset to remove any Code, Name, Currency, Rate Format, or Curve Type constraint specified and refreshes the window.
3. The search results are displayed in a table containing all of the interest rate curves that meet the search criteria. The Interest Rates Summary page offers several icons that allow you to perform different functions when an interest rate curve is selected.
Table 1: Interest Rate – Icons and Descriptions
Fields |
Description |
Add ( |
Click Add icon to build a new interest rate curve. The Add icon is disabled if any row is selected in the table. |
View ( |
Select a single row in the table to enable the View icon. Click View to view the contents of an Interest rate curve in read-only format. The View icon is enabled only when a single Interest rate curve is selected in the table. |
Edit ( |
Selecting a single row out of the pane enables the Edit icon. Click Edit icon to modify a previously saved interest rate curve. The Edit icon is only enabled when a single Interest rate curve has been selected. You can control the number of rows to display on the window by selecting the Pagination Options icon from the action bar. |
Copy ( |
Selecting a single row out of the pane enables the Copy icon. Click Copy icon to create a copy of an existing Interest rate curve. The Copy icon is only enabled when a single Interest rate curve has been selected. |
Check Dependencies ( |
Select an interest rate curve and then click the Check Dependencies to generate a report on all rules that utilize your selected interest rate curve. The Check Dependencies icon is only enabled when a single interest rate curve has been selected. |
Delete ( |
Select one or more rows in the table to enable the Delete icon. Click Delete to delete the selected interest rate curves. |
Execute the Historical Interest
Rates Data Loader ( |
This icon executes a function to import historical rates and parameters for all defined Interest rate curves. For more information on setting up the automated process, see the Oracle Financial Services Analytical Applications Data Model Utilities User Guide. FusionApps.properties file must be present under Web Server <deployed path>/WEB-INF/props and $FIC_WEB_HOME/webroot/WEB-INF/props directories. Update the entry details of the source name. It must be infodom_SOURCE_NAME=Actual_Source_Name. For example, if Infodom Name is DEV6INFO and source Name is DEVETLSRC, then the entry will be DEV6INFO_SOURCE_NAME=DEVETLSRC. Launch the Historical Interest Rates Data Loader from Interest Rates Summary page after making this change. For more information, see the Doc ID 2233513.1. To execute a historical Interest Rate data load, execute the Historical Interest Rates Data Loader. A warning message will appear Upload all available Interest Rates and Parameters? Click Ok to load all historical rates and parameters. Click Data Loader to execute all the interest rates and parameters. |
4. To select an Interest rate curve, select a check box in the first column of the table. More than one Interest rate curve can be selected at a time, but this disable some of the icons.
You can select or deselect all the Interest rate curves in the Summary page by selecting the check box in the upper left-hand corner of the Summary table directly to the left of the Code column header.
The following table provides the Interest Rate details based on the search criteria.
Table 2: Interest Rate – Columns and Descriptions
Column |
Description |
Code |
Displays the interest rate curve's code. Code is an unique number in the range 1 to 9999999. Hover on a row in the pane to display the interest rate curve's detailed description. |
Name |
Displays the interest rate curve's short name. |
Rate Format |
Displays the Interest rate curve's rate format (zero-coupon or yield-to-maturity). |
Compound Basis |
Displays the Interest rate curve's compounding basis (Annual, Semiannual, Monthly, or Simple). |
Accrual Basis |
Displays the Interest rate curve's Accrual Basis (that is, 30/360, Actual/Actual, and so on). |
Currency |
Displays the Currency (Reference Currency) to which an Interest rate curve is applicable. |
Curve Type |
Displays the curve type as an Interest rate curve or Volatility Curve. |
Creation Date |
Displays the Date and Time at which an Interest rate curve was created. |
Created By |
Displays the Name of the user who created the Interest rate curve. |
Last Modification Date |
Displays the Date and Time at which an Interest rate curve was last modified. |
Modified By |
Displays the Name of the user who last modified the Interest rate curve. |
When you Add, Edit, or View an interest rate curve, the Interest Rate Code Details window is displayed. The Interest Rate Code Details window includes an Interest Rate Code Details pane, five Interest Rate Code tabs, and an Audit Trail pane.
The Audit Trail pane is a standard footer pane for every OFSAA rule type. It displays Created By, Creation Date, Last Modified By, and Modification Date on the Audit Trail pane. The User Comments tab can be used to add comments to any rule, subject to a maximum of 4000 characters.
To create an Interest Rate Code, follow these steps:
1. Click Add
 from the Interest Rate Code Summary
page.
from the Interest Rate Code Summary
page.
Figure 2: Interest Rate Code Details window
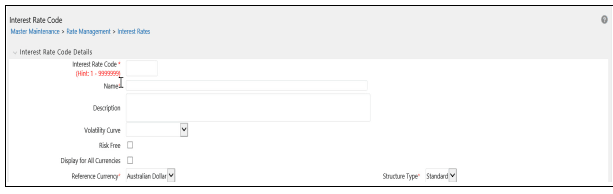
Description of Interest Rate Details window as follows
2. Enter the following information in the Interest Rate Code window.
Table 3: Interest Rate Code window – Fields and Descriptions
Fields |
Description |
Interest Rate Code |
When constructing a new yield curve, you must specify an Interest Rate Code between 1 and 9999999. Interest Rate Codes are used internally to uniquely identify yield curves. When working with Rate Management or other OFS Analytical Applications, you reference yield curves by Name, not by Interest Rate Codes. Interest Rate Codes are embedded within your instrument data (for example, the INTEREST_RATE_CD and T_RATE_INT_RATE_CD columns within the instrument data are populated with Interest Rate Codes). After you have saved a yield curve, you cannot renumber its Interest Rate Code. |
Name and Reference Currency |
You must provide a Name and Reference Currency for your yield curve. Unlike Interest Rate Codes, you can rename or change the Reference Currency for previously saved yield curves. While you can choose to rename a yield curve, however, it is very unlikely that you will choose to modify a yield curve's Reference Currency. A yield curve's Reference Currency is the currency for which your market rates are valid. For example, the Reference Currency for a Prime Rate yield curve would be US Dollars. LIBOR or other internationally quoted rates are always quoted with respect to an underlying Reference Currency (for example, US Dollar LIBOR, Euro LIBOR, and so on). The Reference Currencies drop-down list displays only Active currencies. For more information on Active and Inactive currencies, see the Currency section. |
Description |
You can optionally describe or modify your yield curve's description at any time. |
Structure Type |
This attribute is required for each yield curve. Structure Type supports both Standard and Hybrid yield curve definitions. Hybrid yield curves are re-expressions of one or more pre-existing Standard yield curves. For more information, see Hybrid Term Structure Tab under Interest Rate Code Tabs. After you have saved the yield curve, you cannot change the selected Structure Type. |
Volatility Curve |
You can select the Volatility Curve option to indicate the curve selected will contain volatility rates. If you select this option, all other curve attributes become disabled and the curve is used exclusively for managing volatility details. For FTP Volatility, both the Terms tab and Historical Rates tab are available with this option. For ALM Volatility, only the Historical Rates tab is available. After you have saved the yield curve, you cannot change the selected Volatility Curve. Volatility curves are used in FTP to calculate the Rate Lock Option Costs. ALM Volatility is used to evaluate embedded options for the Black 76 market valuation. |
Risk-Free |
(Optional) This flag is for tagging IRC's as risk-free. That is editable in new and edit modes. It is available for non-hybrid curves and hybrid curves, and not available for Volatility Curves. |
Display for all currencies |
This option allows you to designate certain Interest rate curves to make them available for assumption mapping to any currency. Assumption rules filters the list of Interest Rate Codes based on the currency, when defining assumptions for a specific product/currency combination. When this option is enabled, the Interest Rate Code appears in assumption rules for all currencies. |
3. Click Save. To build out the Interest Rate Code, you must enter data within the Interest Rate Code tabs. For more information, see the Interest Rate Code Tabs section.
Interest Rate Code tabs are used to define the yield curve and to add, edit, or delete historical interest rate data. The Interest Rate Code tabs are:
· Attributes
· Terms
· Historical Rates
· Parameters
· Hybrid Term Structure
For new yield curves, you must begin with the Attributes tab. After you have selected attributes for a yield curve, you can not edit them. After assigning the attributes, navigate to the Terms tab to define a term structure for your yield curve or volatility curve, that is, an overnight rate, a one-month rate, a three-month rate, and so on.
To navigate to the Terms tab, either click Apply on the Attribute tab or click the Terms tab
NOTE |
You must specify an Interest Rate Code, Name, and Reference Currency in the Interest Rate Code Details window before navigate to the Terms tab. |
The first time you navigate to the Terms tab, an initial 1-month term point is provided, but even if this is the only term point you want for the curve, you must click Apply to finish term structure specification. In future revisions to the curve's definition, navigate directly to the Historical Rates tab, but if you modify the term structure, you must always click Apply on the Term tab before navigating to the Historical Rates tab.
The Historical Rates tab is used to input interest rate or volatility data. This tab is used for maintaining the interest rates database. To navigate to the Historical Rates tab, either click Apply on the Terms tab or select the Historical Rates tab if you have already defined your term structure.
NOTE |
You must specify the following before navigating to the Historical Rates tab (1) an Interest Rate Code, Name, and Reference Currency in the Interest Rate Code Details window (2) a term structure in the Terms tab |
Yield curve attributes include Rate Format, Compounding Basis, Accrual Basis, and Curve Identifier.
Figure 3: Attribute Tab of Interest Rate Code window
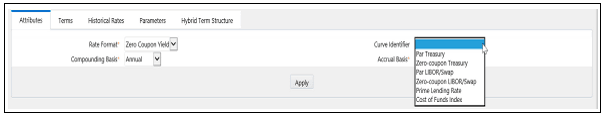
Description of Attribute Tab of Interest Rate Code window as follows
All attributes are disabled if the Volatility Curve is selected.
Table 4: Attributes tab of Interest Rate Code window – Fields and Descriptions
Fields |
Description |
Rate Format |
To define the yield curve, you must select either the Zero Coupon or Yield to Maturity Rate Format. Rates entered into Rate Management (in the Historical Rates tab) are always entered in the nominal form, such as, 5.125% or 6.875%, not as discount factors. For more information on how the two rate formats affect internal cash flow engine calculations, see the Oracle Financial Services Analytical Applications Cash Flow Engine Reference Guide. |
Compounding Basis |
Select a Compounding Basis for the yield curve: Annual, Semiannual, Monthly, or Simple. Annual is the most common method. The Monthly option is enabled based on Rate Format selection (if Rate Format is selected as Yield to Maturity). For more information on Compounding Basis and how different compounding bases affect cash flow calculations in OFSAA, see the Oracle Financial Services Analytical Applications Cash Flow Engine Reference Guide. |
Accrual Basis |
Select an Accrual Basis for the yield curve. The Accrual Basis list depends on the Compounding Basis selection. If the Compounding Basis is selected as Annual, Semiannual, or Monthly, then the following Accrual Basis types are available:
If the Compounding Basis is selected as Simple, then the following Accrual Basis types are available:
For more information on Accrual Basis and how different accrual bases affect cash flow calculations in OFSAA, see the Oracle Financial Services Analytical Applications Cash Flow Engine Reference Guide. |
Curve Identifier |
The curve identifiers can be mapped to the Adjustable Rate Mortgage (ARM) indices used for ADCO prepayment model processing. This is a drop-down list that contains the six Curve Identifier types, that is, Par Treasury, Zero-coupon Treasury, Par LIBOR/Swap, Zero-coupon LIBOR/Swap, Prime Lending Rate, and Cost of Funds Index. The Reference Currency for these indices is always US Dollar. The curve identifier is optional when the IRC is not used for ADCO prepayment model processing. This is applicable only in ALM and HM applications. |
Use the Terms tab to construct the yield curve's term structure. You can specify as many yield curve's terms from 1 day to 100 years range.
Figure 4: Terms Tab on Interest Rate Code window
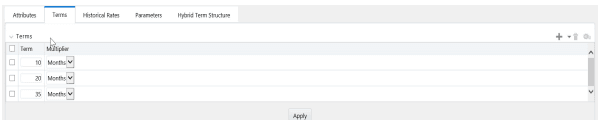
Description of Terms Tab of Interest Rate Code window as follows
NOTE |
When constructing a volatility curve, the term types available are Contract Term and Expiration Term. You must add the relevant terms for each of these dimensions. Click Apply after defining terms for each dimension to save the assumptions before proceeding. |
Fields |
Description |
Adding New Term Points |
Click Add |
Deleting Existing Term Points |
To delete an existing term, select the term
point (or terms) and click Delete |
Use the Historical Rates tab to define, modify, or view interest rate data. Enter data in simple percentages (such as 5.125, 4.875, and so on). If you are entering historical rates for a volatility curve, then enter volatilities for the combination of Contract Term and Expiration Term. Select the desired Expiration Term from the drop-down list to complete the Volatility Matrix. Effective dates must be entered separately for each Expiration term in the list.
Figure 5: Historical Rates Tab on Interest Rate Code window
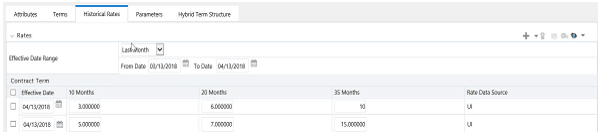
Description of Historical Rates Tab of Interest Rate Code window as follows
NOTE |
FTP Volatility curves are only applicable to FTP Rate lock option cost calculations and ALM Volatility only applies to embedded option market valuation. |
To enter historical rates for an FTP volatility curve, enter volatilities for the Contract Term. Select the desired Expiration Term from the drop-down list to complete the Volatility Matrix. Effective Dates must be entered for each Expiration Term.
To enter historical rates for an ALM Volatility Surface, enter volatilities based on the following two dimensions:
· Strike Rate (Vertical Axis)
· Expiration Date (Horizontal Axis)
For a new ALM Volatility Surface, enter an As of Date and the number of breakpoints for Strike Rate and Expiration Date, then click Generate. The size of the matrix cannot exceed 20 x 20. For Strike Rate, enter values in ascending order. For Expiration Date, enter values in ascending order with values greater than the currently specified As of Date. At every intersection of Strike Rate and Expiration Date, enter a volatility amount in percent (that is, 25 = 25%).
The Rate Data Source parameter shows from where the rates have been taken from, either they are entered through the User Interface, loaded through the Data Loader, or generated using the Generate Rates of Hybrid IRC.
You can perform the following tasks:
· Add Historical Rates
· Rate Lookup Behavior Between Term Points
· Rate Lookup Behavior Beyond Term Points
· Rate Lookup Behavior Between Effective Dates
· Generate Graph
· Excel Import or Export
· Deletion of Historical Rates
· Data Input Helper
By default, the Historical Rates tab displays interest rate data for the past month (for example, for the 30 days leading up to the current date). Click the Effective Date Range drop-down list to expand your view to the last 3 months, 6 months, one year, 3 years, 6 years, or all rate data.
The OFS Cash Flow Engine is common to OFS FTP, OFS PMTPC, OFS ALM, and OFS BSP applications. To lookup rates from Rate Management, the Cash Flow Engine performs an interpolation between yield curve Term Points. For example, in determining a Straight Term Transfer Rate (common for products such as time deposits), the Engine must determine a three-month rate from a yield curve that contains only a one-month rate and a six-month rate. In such a case, the Cash Flow Engine performs interpolation to determine the implied three-month rate. While each of the applications support simple linear interpolation, OFS FTP and OFS ALM also support Cubic and Quartic Spline interpolation methods. These more advanced methods will be supported for all the OFS Analytical Applications in a future release.
If the Cash Flow Engine must determine a rate from a yield curve for a term point smaller than the first term point of the yield curve, then Engine utilizes the first term point of the yield curve. For example, if the Engine must determine an overnight rate from a yield curve whose first term point is one month, the Engine utilizes the one-month rate.
If the Cash Flow Engine must determine a rate from a yield curve for a term point greater than the longest term point on the yield curve, the Engine utilizes the last term point of the yield curve. For example, if the Engine must determine a 30-year rate from a yield curve whose last term point is 10 years, the Engine utilizes the 10-year rate.
When you are looking up rates from Rate Management for a business date, the Cash Flow Engine helps to find if there is no rate data for that specific business date.
For example, in generating an original term transfer rate for an instrument with an origination date of June 14, 2010, the Cash Flow Engine may find rate data for May 31, 2010 and for June 30, 2010 but no rate data for any dates between May 31, 2010 and for June 30, 2010. In such cases, the Cash Flow Engine always falls back to the latest available rate data before the business date of interest (May 31, 2010 in this case).
To delete historical rates entered, select one or more
rows and then click Delete  .
.
The Generate Graph option allows you to generate the graph for selected Historical rates.
To generate a graph, follow these steps:
1. Select the Effective Date Range on Historical Rates tab.
2. The From Date and To Date fields will be automatically updated after selecting the Effective Date Range.
3. Select
the Effective Date using the corresponding Calendar
 icon.
icon.
4. Enter the term points in respective fields and click Apply.
5. Select the Terms using the corresponding check boxes.
6. Click
Generate Graph  .The graph is generated. Here,
you can view the graph for Interest Rate vs Effective Date
or Interest Rate vs Term Point.
.The graph is generated. Here,
you can view the graph for Interest Rate vs Effective Date
or Interest Rate vs Term Point.
NOTE |
Starting from 8.0.4 release, the Excel Import feature will work only on that Internet Explorer browser. Excel Export feature is supported by all browsers such as Chrome or Firefox. |
To aid in data entry, use the Excel Import or Export functionality to add or edit rate data to historical rates. This is an optional step.
Excel Export:
To export the data, follow these steps:
1. On the Interest
Rates tool bar, click the Excel  icon.
icon.
2. Click Export to export data for the chosen selected effective date range. Within the same block, select Export to Excel, which launches the Excel application and displays the data window including headers.
Figure 6: Export and Import options for Historical Rates data
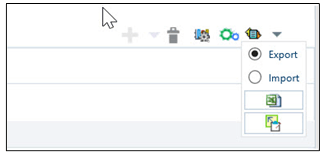
Description of Export and Import options for Historical Rates data as follows
Excel Import:
You can add rows to the pane in the same format. After complete data is entered (or existing data is edited), copy the range of the pane you want to append and go back to the Historical Rates pane. In the same block, click the Import . The data copied from excel will appear in the Historical Rates pane.
1. If appending data that pre-existed for the same effective date, the import it will overwrite existing data.
2. In some cases, some fields will be output to the pane that is not editable, such as bucket start and end dates (when defining forecast assumptions). Add or edit data in the columns that would be editable only in the UI itself.
Use the Data Input Helper feature to copy from a row where you have already defined the interest rate definition or apply a fixed value down the page. This is an optional step. To use data input helper, follow these steps:
1. Select the check box next to the rows that you want to work with or use the Select All option by selecting the check box on the header row.
2. Select Data
Input Helper  .
.
3. From the Data Input Helper window, select method – Grow by Amount or some other appropriate method.
4. Select the term points from the Available Columns list and click Add or Add All to move the data to the Selected Columns list.
Figure 7: Data Input Helper window
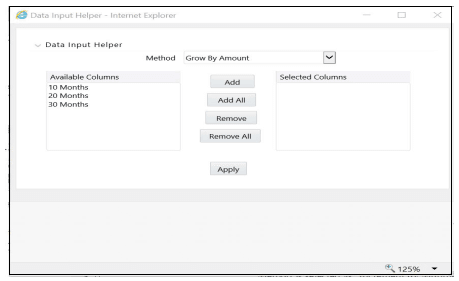
Description of Data Input Helper window as follows
Based on the selected method, the list of Available Columns will vary. If Method is selected as Increment By Months, Increment By Days, or Increment By Years, then only Effective Date option is displayed in the Available Columns list.
5. Click Apply to modify the Start date and enter the Incremental Value.
Fixed income instruments are used for forecasting and simulating the Cash Flows. The Cash Flow Engine needs interest rate models to simulate the evolution of interest rates. The Cash Flow Engine uses these models as part of the stochastic engine. You can enter the parameters for these models in the following ways:
· System-generated calculations through Parameter Estimation
· Direct input into the UI
· Excel Import
· UI entry through Data Input Helper methods
· Data Loader
Following interest rate models are available:
· Extended Vasicek
· Ho and Lee
· Merton
· Vasicek
Parameter Estimation
This section explains the procedure to calculate the estimated parameters.
Prerequisites
Installation of R and Oracle R Enterprise (ORE) is required to use the Term Structure Parameter Estimation functionality under Rate Management – Interest Rates, for computing term structure parameters.
For more information, see the Oracle Financial Services Asset Liability Management Application Pack Installation and Configuration Guide.
Conditions for Parameter Estimation
If the following conditions are met, you can calculate parameters for any Term Structure Model for a given Effective Date, based on your relative look back term and a sufficient number of observations (available historical rates) for the IRC. If you rerun with a different look-back term, it will overwrite the existing parameters for the selected Term Structure Model on that IRC's Effective Date.
· Term point: Underlying historical rates must be available for a 30-Day or 1-Month term point.
· Minimum Number of historical rates: A total of at least 10 historical rates (observations) are required, on appropriate look-back dates.
· Lookback Dates: Historical rates must be available on dates looking back from the Parameter's Effective Date (the End Date), in 30-day intervals moving backward from End Date to Start Date, for a minimum of 10 intervals.
For example: If the first rate's Effective Date is 1 Jan. 2013, then the second rate's date must be 2 Dec. 2012 (1 Jan. 2013, 30 days = 2 Dec. 2012), and so on. If a rate is not found for the required date, the engine looks for a rate within the neighborhood of 5 days up or down (therefore a total range of 10 days), searching iteratively starting with Date -1, then Date +1, through Date +5, then Date -5. The next rate lookup would be 60 days prior to the End Date, and so on.
The minimum relative term for all lookbacks must be at least 300 Days (that is, to accommodate a minimum of ten 30-day intervals). Using the above logic, if a rate is not found for the lookup date (or date within the neighboring range), an error will be logged in FSI_PROCESS_ERRORS with ID_Number to identify the Interest Rate Code, and the parameter estimation Engine will exit.
To define the Parameter Estimation, follow these steps:
Figure 8: Parameters Tab on Interest Rate Code window
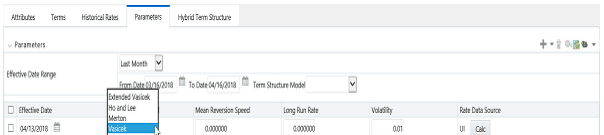
Description of Parameters Tab of Interest Rate Code window as follows
1. To edit or recalculate the existing Parameters, enter the Effective Date Range filter.
Following icons are available here:
§ Add

§ Delete
§ Data
Input Helper
§ Refresh

§ Excel
Export or Import
2. Default parameters for the Extended Vasicek Model are displayed for one Effective Date (the System Date on which the Interest Rate Code was created). You can edit these parameters or add new parameters using the Add. Use the Refresh to return to existing Parameters.
NOTE |
Steps 3 and 4 are applicable only if you are Adding or Editing Parameters. |
To add or edit the parameters, use the Data Input Helper or Excel Import or Export. For more information, see the Excel Import or Export and Data Loader sections.
3. Enter the Effective Date. Here, Effective Date cannot be greater than the Current System Date.
4. Select the Model from the Term Structure Model drop-down list. Effective Date and Term Structure Model combination must be unique within this IRC.
5. The following term structure models are utilized in stochastic modeling of interest rates in OFS FTP and OFS ALM:
§ Extended Vasicek
§ Ho and Lee
§ Merton
§ Vasicek
6. The following parameters needed by the models:
Table 5: List of supported parameters for Models Term structure models in Interest Rate
Model |
Parameter 1 |
Parameter 2 |
Parameter 3 |
Extended Vasicek |
Volatility |
Mean Reversion Speed |
|
Ho and Lee |
Volatility |
|
|
Merton |
Volatility |
|
|
Vasicek |
Volatility |
Mean Reversion Speed |
Long Run Rate |
7. Values for Long Run Rate and Volatility are in percentages.
For example, a Long Run Rate of 5% is displayed as 5.000. To maintain the integrity of data, Rate Management restricts the accepted input values. The valid range and the default setting for each parameter.
Table 6: Valid Rang and Default Values of Interest Rate Parameters
Parameter |
Valid Range |
Default Value |
Volatility |
0% to 500% |
0.01 |
Mean reversion speed |
0.00 to 500 |
0.0 |
Long run rate |
0.00% to 500% |
0.0 |
8. The Rate Data Source indicates if you have directly entered Parameters through the UI. You can calculate the Parameters to display system-generated values.
9. Select the Calculate to view the Term Structures Parameter Estimation window.
10. If you are directly entering the Parameters, then enter values appropriate to the Model, then click Apply else click Calculate.
11. End Date is auto-populated with Effective Date. Enter the Relative Term with Multiplier to define the rate look-back period.
12. The Term or Multiplier value must be at least 300 Days.
13. Start Date is automatically updated after entering a Relative Term.
14. Click Calculate Number of Observations to confirm the number of rates found for appropriate dates within the Relative Term. If there are at least 10 observations, then the Estimate option will become active.
15. Click Estimate to calculate the parameters and store them in the Historical Parameters table (FSI_IRC_TS_PARAM_HIST). A confirmation message is displayed. Click Ok. The calculation will complete and you will be directed back to the Parameters tab.
16. Similar to the validation used for direct input from the UI, if any of the calculated parameters are outside of the valid range, the Engine displays an error message.
Delete parameters by selecting one or more rows and then
clicking Delete . For
more information on term structure models and stochastic processing, see
the Oracle Financial Services Funds Transfer Pricing User
Guide, Oracle Financial Services Asset Liability Management (OFSALM) User
Guide, and Oracle Financial Services Analytical
Applications Cash Flow Engine Reference Guide.
Hybrid Term Structures allows you to specify the following three types of Hybrid yield curves:
· Spread
· Moving Average
· Merge
NOTE |
Minimum and Maximum Hybrid IRC types from the Hybrid IRC type selection is intended for future enhancement and must be ignored in the current release. The Parameters and Hybrid Term Structure tabs are disabled if the Volatility Curve is checked. |
Hybrid yield curves are built up from either one or more standard yield curves. When you add, modify, or delete any historical rate data from a standard yield curve, the data associated with any related hybrid yield curve must be updated. After defining, the Hybrid yield curves can be used like any other interest rate curve in the system. You can reference these curves within the OFSAA application business rules that allow the selection of an Interest Rate Code.
Figure 9: Hybrid Curve tab on Interest Rate Code window
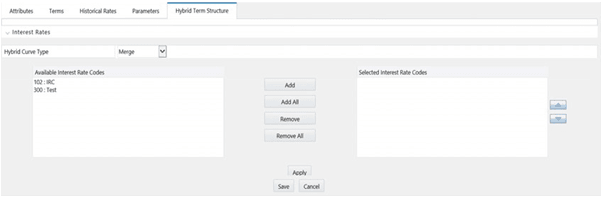
Description of Hybrid Curve Tab of Interest Rate Code window as follows
Table 7: Hybrid Curve tab to create a new Interest Rate Code – Fields and Descriptions
Fields |
Description |
Hybrid Curve Type |
Spread A Spread hybrid yield curve is defined as the difference between two standard yield curves. The Spread type of hybrid yield curve is useful in establishing liquidity risk or basis risk yield curves. Moving Average Moving average hybrid yield curves represent moving average data of a single underlying standard yield curve. These curves are used in Funds Transfer Pricing. Merge Merge hybrid yield curves represent a blending of two or more underlying yield curves. In constructing a Merge type of hybrid yield curve, specify the percentage weighting applied to each of the underlying standard hybrid yield curves. |
To define a hybrid curve, follow these steps:
1. Select the Source Type as Hybrid in the Hybrid Term Structure tab, and then select the Hybrid Curve Type (Spread, Moving Average, or Merge).
2. Select the Interest Rate Codes for the hybrid type and click Apply.
After a hybrid curve is defined, generate the Historical Rates as far back as the rate source curves allow. The Generate Frequency determines the frequency of the historical rates populated with the Generate function. If you select the Generate Frequency as monthly, it generates month-end values only. If you select daily, it generates the maximum number of historical values.
To generate the rates, follow these steps:
1. Select the interpolation method as Linear, Cubic, or Quartic.
2. Select the Generate Frequency (Daily, Weekly, Bi-Weekly, or Monthly) and enter the Specific Date Range (From Date and To Date).
3. Click Generate. The rates will be populated and you will be directed to the Historical Rates tab to view the results.
If Hybrid Curve Type selected as Moving Average, then select the Moving Average Term in Days, Months, or Years.
The generation of the Hybrid IRC rates is available within the Hybrid IRC of Rate Management UI. As a manual process, you can additionally schedule a Run through an ICC Batch process or through a Simplified Batch process.
If you are running Generate Rates through the UI, then provide the following three parameters:
1. Interest Rate Code: For example, you are in edit mode for a particular Hybrid IRC, execute the Generate Rates option. So, the IRC is implied.
2. FROM DATE: this is the start date of the generate rates process.
3. TO DATE: this is the date to which hybrid rates will be computed.
When generating Hybrid Rates through a batch (ICC or Simplified), specify ALL in the Parameter list to generate rates for all Hybrid IRCs. Or, a list of IRCs can be specified with comma-separated values within quotes.
'IRC_Code1, IRC_Code2, IRC_Code3' and so on
NOTE |
Use ALL in the Parameter list for all IRCs. |
The TO DATE is determined based on the Effective Date specified for the Batch and the FROM DATE for each IRC is determined by referring to the last (maximum) effective date in the current historical rates table +1 day.
There is one exception to the calculated FROM DATE. In cases where a new Hybrid IRC is generating rates for the first time, the minimum Effective Date from the Parent IRC is used as the FROM DATE.
NOTE |
Hybrid Rates generated by the Generate Rates procedure are written to the FSI_IRC_RATE_HIST table. Outputs from the procedure can be verified within the Interest Rates UI or by querying this table directly. |
Topics:
· Dependent Tables
· Prerequisites to running - Hybrid IRC batches
· Batch Creation and Running Batches
· Viewing Log Messages
Dependent Tables
The following table describes the details of the Dependent Tables.
Table 8: List of Dependent Tables
Table Name |
Description |
FSI_IRCS |
Holds header information of all Interest Rate Codes. |
FSI_IRC_HYBRID_STRUCT_WEIGHT |
Holds the Hybrid IRCs' - Interest Rate Term, Interest Rate Term Mult, and Rate Weightage. It is the child Table of FSI_IRCS. |
FSI_IRC_RATE_HIST |
This Output table holds calculated rates for the Hybrid IRCs, as well as all historical rates for non-hybrid IRCs input through the Interest Rates UI or loaded directly using the interest rates data loader program. |
FSI_MESSAGE_LOG |
Holds error log information. |
DATE_TASK_MASTER |
Located in the Config Schema. This table must have a seeded date for IRC_HYBRID_SCHEDULER DT. |
DATE_TASK_STEP_PRECEDENCE |
Similar to DATE_TASK_MASTER, this table must also have an entry for IRC_HYBRID_SCHEDULER DT |
Prerequisites to Running Hybrid IRC Batches
· The function FN_FSI_IRC_HYBRID_SCHEDULER must be in Compiled status in the Atomic schema. Sometimes, the functions created in the Database can be in an invalid state due to some issues (by the installer), so use the Compile option in Database to get them in a valid state.
· You can create the ICC batch using the IRC_HYBRID_SCHEDULER rule name, which is seeded with the installation.
· Hybrid IRC rates are calculated based on their underlying standard IRC rates, which are also stored in the FSI_IRC_RATE_HIST table. Historical Rates must already exist for all parent and dependent IRCs for the relevant effective date range.
NOTE |
Seeded data related to Batch information must be present in the DATE_TASK_MASTER and DATE_TASK_STEP_PRECEDENCE tables in the Config schema. |
Batch Creation
There are two methods for creating and running the batch processes, ICC Batch and Simplified Batch. The following section describes how to set up and run the Hybrid Rate Generation using both approaches.
For more information, see the Oracle Financial Services Analytical Applications Infrastructure User Guide.
Running Hybrid Rate Generation using ICC Batch:
1. Navigate to Common Object Maintenance, select Operations, and then select Batch Maintenance. Click Create Batch.
Enter the following details in the Batch Maintenance window:
Component = “Transform Data”
Rule Name = “IRC_HYBRID_SCHEDULER”
Parameter List = 'IRC_Code'
NOTE |
Use 'ALL' in the Parameter list to use all IRCs. |
2. Save the batch.
3. Navigate to Common Object Maintenance and select Operations, and then select Batch Execution.
4. Search the Batch created under Batch Maintenance and select it.
5. Enter the Information Date for the batch.
6. Click Execute Batch
To schedule a future Hybrid Rate Generation Batch Process, or to schedule the Hybrid Rate Generation Batch Process on a recurring basis, do the following:
1. Navigate to Common Object Maintenance and select Operations, and then select Batch Scheduler.
2. Search the Batch to schedule and select it.
3. Click New Schedule or Existing Schedule:
NOTE |
An Existing Schedule can be selected only if there are existing scheduled batches to view. |
4. If New Schedule is selected, the New Schedule details appear. Enter the Scheduled Task Name.
5. To schedule the Hybrid Rate Generation on a recurring basis, select Daily, Weekly, Monthly, or Adhoc.
6. In the Schedule Task pane, enter Start Date and End Date in the Date field.
7. In the Run Time field, enter the time for the next validation to be run.
8. Click Save to set the schedule as specified or Cancel to drop your changes.
Any error messages or warnings generated during the Hybrid Rate Generation process that is displayed in the View Log.
For more information, see the Oracle Financial Services Analytical Applications Infrastructure User Guide.
Running Hybrid Rate Generation using Simplified Batch
To run Hybrid Rate Generation using Simplified Batch, follow these steps:
1. Navigate to Common Object Maintenance and select Operations, and then select Simplified Batch.
2. Click Add.
3. From the Task Details block, click Select Task. In the Task Selection window, select Task Type as Transform Data. Click Search. In the Task Selector, select the IRC_HYBRID_SCHEDULER and click Ok.
4. Enter the Parameters and click Save.
5. In the Simplified Batch Summary page, search the Hybrid Rate Generation batch and select it. Click the Run icon.
6. Click Yes to confirm you want to continue, enter a date (this will be your TO DATE), and click Ok to continue. A confirmation message is displayed.
7. Click Ok. When the batch is complete, navigate to Operations and select View Log to view the processing log.
Any error messages or warnings are accessible from the View Log window.
NOTE |
Simplified Batch does not provide access to logs for Transform Data tasks. |
For more information, see the Oracle Financial Services Analytical Applications Infrastructure User Guide.
Any error messages or warnings generated during the rate generation batch are displayed in the Log Information window. To access this window:
1. Navigate to the Operations menu and select View Log.
2. Enter search criteria as Data Transformation and related Batch ID
3. Select the Task ID to view the log information
You can additionally query the FSI_MESSAGE_LOG table directly to view the error log details.
For more information, see the Oracle Financial Services Analytical Applications Infrastructure User Guide.
Financial institutions transact business in more than one currency. Transacting business in multiple currencies demands functional capabilities for multi-currency accounting and currency rate management.
OFSAA Rate Management's Currency module supports the definitions and maintenance of currencies. Currency definitions are fundamental to the definition of both interest rate yield curves and currency exchange rates. A key attribute of every yield curve is the currency with which it is associated, and currency exchange rates can only be established between defined currencies. OFSAA Rate Management provides a comprehensive list of ISO-defined currencies; you can also define and add your user-defined currencies.
To view the Interest Rate Code Summary page, navigate to Common Object Maintenance and select Rate Management, and then select Currency. This page displays a comprehensive list of more than 170 seeded ISO currency codes.
Figure 10: Currency Summary page
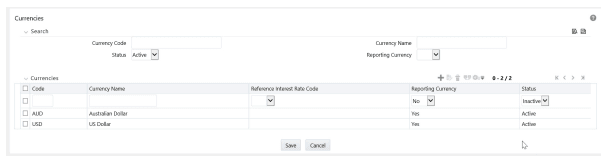
Description of Currency Summary page as follows
A Search pane is provided to search for currencies by Name, Currency (by ISO currency code), Status, or Reporting Currency.
To search the currency, follow these steps:
1. Enter the search criteria and click Search.
2. Click the Reset to remove the search criteria you can have specified and refreshes the window.
3. The search results are displayed in a tabular format containing all of the currencies that meet to search criteria. The Currency summary pane offers several icons to perform different functions when a currency is selected.
Table 9: Currency – Icons and Descriptions
Fields |
Description |
Add |
Click Add to begin the process of adding a new currency. The Add icon is disabled if any rows in the pane have been selected. |
Edit |
Select a single row out of the pane to enable the Edit. Click the Edit icon to modify an existing currency. The Edit icon is only enabled when a single currency has been selected. You can control the number of rows to display on the page by selecting the Pagination Options icon from the action bar. |
Delete |
Select one or more rows out of the pane to enable the Delete icon. Click the Delete icon deletes the currency or currencies you have selected. |
Check Dependencies |
Select a currency and then click the Check Dependencies icon to generate a report on all rules that utilize your selected currency. The Check Dependencies icon is only enabled when a single currency has been selected. |
4. The Currencies window contains all of the currencies that meet the search criteria. The Currencies Summary page has several icons to perform different functions when a currency is selected.
To select a currency, select the check box in the first column of the pane. More than one currency can be selected at a time but this will cause some of the icons to become disabled. Select a check box a second time deselects the currency.
Select or deselect all of the currencies in the Summary page by selecting the check box in the upper left-hand corner of the Summary page directly to the left of the Code column header.
The following table provides the currency details based on the search criteria:
Table 10: Currency Summary page- Columns and Descriptions
Columns |
Description |
Code |
For seeded currencies, these are ISO Currency Codes. For user-defined currencies, these can be any pure character string (no numbers) up to a length of 3 characters. |
Currency Name |
For seeded currencies, these are ISO Currency Codes. For user-defined currencies, these can be any string up to a length of 40 characters. |
Reference Interest Rate Code |
Reference Interest Rate Code is the Interest Rate Code with which currency is associated with forecasting purposes. Define multiple yield curves each of which has the same Reference Currency, but a currency can only have one Reference Interest Rate Code. |
Reporting Currency |
A reporting currency is an active currency to which balances in other currencies can be consolidated to facilitate reporting. Balances in reporting currencies can be, in turn, consolidated to the functional currency. For example, an American multinational bank might consolidate its holdings in Asian currencies to the Japanese yen (Reporting Currency) and its balances in European currencies to the Euro (Reporting Currency) after which it might consolidate these reporting currencies to the U.S. dollar (Functional Currency). |
Status |
The status of any currency can be either Active or Inactive. You must Activate a currency before doing followings: 1. Define that currency as a Reference Currency for a yield curve (For more information, see the Reference Currency section in Interest Rates Details window.) 2. Enter Exchange Rate data for a currency (For more information, see the Currency Rates section.) 3. Define Forecast Rates for that currency within OFS ALM (For more information, see the Forecast Rates section) |
To edit a currency, select a currency, click Edit
 . You can not modify any currency Code value. You
can modify Currency Name, Reference Interest Rate Code, Reporting Currency
value (Yes or No), and the currency's Status (Active or Inactive).
. You can not modify any currency Code value. You
can modify Currency Name, Reference Interest Rate Code, Reporting Currency
value (Yes or No), and the currency's Status (Active or Inactive).
You can not inactivate any currency that is:
· Defined as the Reference Currency for any yield curve
· Associated with any exchange rate data
· Utilized within any Forecast Rates rule within OFSAA Asset/Liability Management
After completing the edits, click Save.
To add a currency, follow these steps:
· The first row in the Currencies window is an empty row that is ready for you to edit as a new currency. Select this empty row, click Edit, and generate the new currency.
or
· Generate a new currency by clicking on the Add. This generates another empty row at the top of the Currencies window to edit purpose.
Select one or more currencies and then click Delete. You can not delete any currencies that are utilized elsewhere in the system.
OFSAA Rate Management's Currency Rates module uses the currencies defined and activated in the Currency module to support the creation and maintenance of historical exchange rates. Currency exchange rates are utilized in:
· OFSAA Funds Transfer Pricing Ledger Migration processes (see the Oracle Financial Services Analytical Applications Funds Transfer Pricing User Guide)
· OFSAA Asset Liability Management Currency Consolidation process (see the Oracle Financial Services Analytical Applications Asset Liability Management (OFSALM) User Guide)
· OFSAA Profitability Management multi-currency allocations (see the Oracle Financial Services Analytical Applications Profitability Management (OFSPM) User Guide)
· OFSAA Hedge Management and IFRS Valuations (see the Oracle Hedge Management and IFRS User Guide)
To view the Currency Rate, navigate to Common Object Maintenance and select Rate Management, and then select Currency Rates. In this window, you can manage historical exchange rates between currencies.
For ALM, FTP, and PFT, From Currency defaults to the Initial Currency selection from the Assumption Management defaults in the active Application Preferences window. You can select another From Currency from drop-down list that displays all Active currencies.
To view, edit, or delete the exchange rate data, you must enter To Currency value. With the From Currency, the To Currency drop-down list displays only Active currencies.
Figure 11: Working with Exchange Currency Rate Data
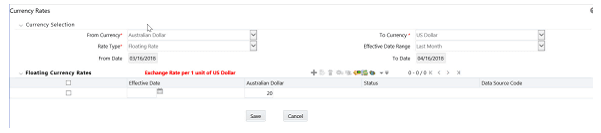
Description of Working with Exchange Currency Rate Data as follows
After selecting a To Currency value, select a value for Rate Type as Floating Rate or Fixed Rate (the default selection is Floating Rate). After selecting a To Currency value, a second pane is displayed as Floating Currency Rates (if you have chosen a Rate Type of Floating Rate) or Fixed Currency Rates (if you have chosen a Rate Type of Fixed Rate).
· Floating Rates
Floating exchange rates, such as those between the US Dollar (USD), the Pound Sterling (GBP), the Japanese Yen (JPY), and the Euro (EUR), are market-driven and can change from day-to-day, hour-to-hour, or minute-to-minute.
· Fixed Rates
Some countries, especially smaller countries or countries that have experienced significant inflation in the recent past, can wish to “peg” their currency to a larger, more stable currency such as the US Dollar, Japanese Yen, or Euro.
After you have specified a value for To Currency, the Floating Currency Rates section appears. To define a Fixed Rate relationship, select the Fixed Rate Type and replace the Floating Currency Rates with the Fixed Currency Rates.
Both Currency Rates panes initially display a single blank row followed by the most recent month's exchange rate data (if any such exchange rate data already exists). To enter a single new exchange rate data point, enter data into the blank row, and click Save.
Figure 12: Defining a Currency Rate
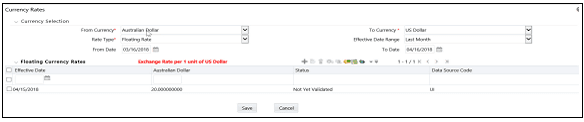
Description of Defining a Currency Rate as follows
Table 11: List of columns on Currency Rate window
Fields |
Description |
Effective Date |
Directly enter a date
or select the Calendar Rate Management stores the historical exchange rate data. You cannot enter exchange rate data for dates greater than the current date. For more information regarding rate forecasts and the relationship between historical exchange rates for forecasted exchange rates, see the Forecast Rate Scenarios. If you have gaps in the historical exchange rate data, any OFS Analytical Application that needs to perform a rate translation function will fall back to the most recent date for which exchange rate data exists. For example, if an OFS Analytical Application needs to translate a rate from USD to EUR for February 22, 2010 and the latest available USD to EUR rate data in the Rate Management database is February 11, 2010, then the application will utilize the exchange rate for February 11, 2010. |
Status |
Status is a read-only display which is updated after the Currency Rates Validation has been run. |
Data Source Code |
The Data Source Code is displayed read-only and indicates whether the rates were input through the UI or the data loader. |
Currency Exchange Rate |
For both Floating Rates and Fixed Rates, units of the From Currency are converted to one unit of the To Currency. See Table 12 for example. |
Table 12: Example of one Currency to another Currency Conversion
From Currency |
To Currency |
Approximate Rate |
USD – US Dollar |
GBP—Pound Sterling |
1.50 |
USD – US Dollar |
EUR – Euro |
1.36 |
USD – US Dollar |
JPY – Japanese Yen |
0.01105 |
Click Add to add additional
blank rows to enter the additional Effective Dates and Exchange Rates.
After adding the multiple new exchange rates, click Save.
Select the check box on the left-hand side of any row to
enable the Edit icon.
After clicking Edit, the row becomes active to edit the Effective
Date and (or) the Exchange Rate. Click Save to save the changes.
By default, both the Floating Currency Rates pane and the Fixed Currency Rates pane display the most recent month of historical exchange rate data. You can control the amount of data displayed by selecting a different value from the Effective Date Range drop-down list in the Currency Selection window.
Click View  icon to a specific
range of effective dates by modifying the From Date,
To Date, or both dates within the Currency
Rates window.
icon to a specific
range of effective dates by modifying the From Date,
To Date, or both dates within the Currency
Rates window.
Select one or more check boxes on the left-hand side of
any row to enable the Delete
icon. After clicking Delete, a confirmation
message is displayed. Click Ok.
The Data Loader  icon executes a function to import historical Currency rates for all defined
Currencies. For more information on setting up the automated process,
see the Oracle
Financial Services Analytical Applications Data Model Utilities User Guide.
icon executes a function to import historical Currency rates for all defined
Currencies. For more information on setting up the automated process,
see the Oracle
Financial Services Analytical Applications Data Model Utilities User Guide.
To execute a data load, click the Data Loader icon. A warning message is displayed Upload all available Currency Rates?
NOTE |
Click the Data Loader icon to execute all the currency rates. |
The Excel Import/Export functionality is used to add or edit historical exchange rates.
NOTE |
To export exchange rates, Enable visual style and in webpages option in Internet Explorer must be enabled. Otherwise, it can show an error message. |
Exchange Rate Validation has the following features:
l Movement of historical exchange rates to the Currency Direct Access table.
l Calculation of inverse exchange rates for reporting currencies.
l Calculation of triangulated exchange rates where possible.
NOTE |
This feature is equivalent to the Rate Validation capability in OFSA 4.5 Rate Manager. |
The goal of exchange rate validation is to ensure that exchange rates from all active currencies to all reporting currencies are available for processing in the OFSAA applications. Some of these rates can come from the validated direct input, others are calculated based on relationships with other rates. To support triangulation, all fixed exchange rates are available for all currencies that make up a exchange that needs to be triangulated. Also, a direct exchange rate between each Child currency and each reporting currency is calculated and supplied to support quick access to exchange rates. If a Child currency is a Reporting Currency, then Exchange Rates are calculated for all currencies having an exchange relationship with the Parent currency.
1. Load currency rates through the Rate Management or using the Historical Rate Data Loader. The initial status is Not Yet Validated.
2. Execute the Currency Rate Validation engine.
Navigate to Operations and select Batch Maintenance, and then click Create Batch.
§ Component = “Transform Data”
§ Rule Name = “Rate_Validation”
§ Parameter List (Required) = FROM_DATE and TO_DATE, for example, '20110101', '20110131'
After completion of the validation process, the status in theCurrency Rates window changes toValid or Invalid (in case there is an issue).
3. View both input and calculated results in the FSI_EXCHNG_RATE_DIRECT_ACCESS table. The OFSAA processing engine reads this table for sourcing historical exchange rates.
NOTE |
Executing Rate Validation is a required step when a multi-currency setup is enabled. All of the OFSAA processing engines require exchange rates to be validated through this process to convert results from base currency to a selected reporting currency. If exchange rate validation is not run or required exchange rates are not available, the engines will use default exchange rates = 1. |
You must run the exchange rate validation process after adding or modifying exchange rate data. Run the process immediately or schedule one or more to be run in the future.
Each exchange rate has one of the following statuses:
Table 13: Details of exchange rates
Status |
Description |
Not Yet Validated |
The exchange rate has been input or loaded but not yet validated |
Valid |
The exchange rate has been validated. |
Invalid |
The exchange rate has violated one or more acceptance rules. |
Only exchange rates in Valid status are available for processing and they are not subject to future validation unless you edit them. The Rate Validation status is displayed in the Currency Rates window of the Rate Management.
Exchange Rate Validation Criteria
In the rate validation process, all exchange rate relationships in the database are examined for compliance with the following criteria. Error messages and warnings are displayed if one or more criteria are not met. For more information, see the Viewing Log Messages.
1. If a currency is defined as a Child in a fixed exchange relationship then it must not be in any floating (standard) exchange rate relationship at the same time. Consequently, all floating exchange rates to or from the Child currency must be defined through the Parent currency. If this criterion is not met then the following message is displayed: Invalid fixed relationship—Child currency exists in a standard exchange rate within the same time period.
2. A Child currency within a fixed relationship must not be a Child currency in any other fixed relationship during the same time period. If this criterion is not met then the following message is displayed: Invalid fixed relationship—Child currency already exists in a fixed relationship for the same time period.
3. A circular relationship must not exist. In other words, a Child currency cannot link back to its Parent in any other fixed-rate relationship within the same time period. If it does, then the following message is displayed: Invalid fixed relationship creates a circular relationship with other fixed exchange rates.
4. Regarding new floating (standard) exchange rates, From and To currencies must not exist as Child currencies within any fixed exchange rate relationships. If this criterion is not met then the following message is displayed: From/To/Both currency(ies) in the new exchange rate already exist in a fixed relationship for the same time period.
5. If any exchange rate is equal to 0, then a warning message is displayed. Generally speaking, 0 is a valid value. You can use it, for example, to designate an exchange rate with a currency of a country that no longer exists.
If two exchange rate relationships fail to meet these criteria then both of them will be labeled Invalid. (Exception, if one of the relationships is already in Valid status, then the other one will be labeled Invalid.) For example, if a currency is defined as a Child in a fixed rate relationship and is also defined as being in a floating relationship at the same time, then both fixed and floating rates for that currency will be labeled Invalid.
If there are both direct and inverse floating exchange rates defined for any two currencies (in other words, one currency is both a To and a From currency in relation to the other), then both relationships will be marked Valid.
You can run a validation immediately or schedule one or more for later. The validation status is displayed in the Currency Rates window of the Rate Management.
Execute the exchange rate validation using the Currency Rates Validation option.
Figure 13: Currency Rate Validation window
Description of Currency Rate Validation window as follows
To execute the exchange rate validation, follow these steps:
1. Select a check
box on the left-hand side of any row to enable the Currency Rates Validation
 icon.
icon.
2. Click Currency Rates Validation.
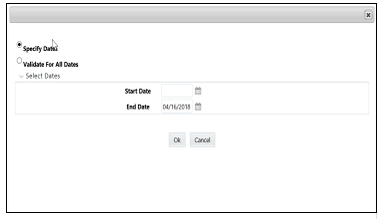
3. To execute exchange rate validation from the Currency Rates window, the following two options are available:
§ Specify Dates: After selecting this option, a Select Dates pane is displayed to enter or verify the FROM_DATE and TO_DATE parameters. These dates will be passed to the batch for execution.
§ FROM_DATE: This defaults to the date of last rate validation.
§ TO_DATE: This defaults to the current date.
§ Validate For All Dates: Select this option to validate all the rates irrespective of dates.
NOTE |
This option will replace all of the validated exchange rate history and can be a time-consuming process depending on the amount of history available to be processed. |
You can execute rate validation using a Simplified Batch or the ICC Batch window. You can also launch it from the Currency Rates UI (Currency Rates Validation tool bar ).
To run the validation using the Simplified Batch, follow these steps:
1. Click Common Object Maintenance and select Operations, and select Simplified Batch, and then click Add.
2. From the Task Details block, click Select Task. In the Task Selection window, choose Task Type as Transform Data. Click Search. In the Task Selector window, select the Rate_Validation and click Ok.
3. Back in the Simplified Batch Definition window, enter the optional parameters to specify the From and To dates, using the format YYYYMMDD, YYYYMMDD.
4. From_Date and To_Date must not be the same value. Set From_Date equal to the last rate validation date and To_Date to the current date. This will ensure that the Effective To Date for the prior record is set correctly.
5. Click Save.
6. In the Simplified Batch Summary page, search for and select your batch, then click Run.
7. Click Yes to confirm you want to continue, enter a Date and click Ok to continue.
8. You will receive a message that it has been successfully launched.
9. Click Ok. When the batch is complete, optionally navigate to Operations and select View Log to view the processing log.
10. Any error messages or warnings are displayed in View Log. For more information, see the Viewing the Messages.
11. Simplified Batch does not yet provide access to logs for Transform Data tasks.
12. For more information, see the Oracle Financial Services Analytical Applications Infrastructure User Guide.
To run the validation using the ICC Batch Framework, follow these steps:
1. Navigate to Operations and select Batch Maintenance, and then click Add to create a new batch.
2. Search for the above batch, and select it.
3. In the Task Details block (tool-bar), click Add. In the Task Selection window, choose Task Type as Transform Data. Click Search. In the Task Selector, select the Rate_Validation task and click Ok.
4. Back in the Task definition window, select the Rule Name as Rate_Validation and enter the optional parameters to specify the From and To dates, using the format YYYYMMDD,YYYYMMDD.
From_Date and To_Date must not be the same value. Set From_Date equal to the last rate validation date and To_Date to the current date. This will ensure that the Effective To Date for the prior record is set correctly.
Click Save.
5. Navigate to Operations and select Batch Execution. Search your batch and select it. Enter Information Date and click Execute Batch.
6. Click Ok. A message is displayed stating Batch triggered successfully, also displaying the Batch Run ID.
7. Click Ok.
8. To view rates, query the database table FSI_EXCHNG_RATE_DIRECT_ACCESS after the run is complete.
9. FSI_EXCHNG_RATE_DIRECT_ACCESS: This output table holds the valid currency codes and their exchange rate with respect to the reporting currency for a period of time say From Date value to optional To Date value. When Exchange Rate Validation runs, if data already exists for the selected date range, the Rate Validation package will overwrite the existing values. If no dates are given, the Rate Validation package truncates this table and re-loads data for the entire historical date range. The following describes the structure of theFSI_EXCHNG_RATE_DIRECT_ACCESS table:
Table 14: Column details of FSI_EXCHNG_RATE_DIRECT_ACCESS table
Column Name |
Nullable |
Data Type |
FROM_CURRENCY_CD |
Not Null |
varchar2(15) |
TO_CURRENCY_CD |
Not Null |
varchar2(15) |
EFFECTIVE_FROM_DATE |
Not Null |
Date |
EFFECTIVE_TO_DATE |
Not Null |
Date |
EXCHANGE_RATE |
Not Null |
Number(15,9) |
EXCHANGE_RATE_CONVERT_TYPE_CD |
Not Null |
Number(5) |
EXCHANGE_RATE_CONV_FORMULA |
Not Null |
Number(15) |
10. When the batch is complete, navigate to Operations and select View Log to view the processing log. Any error messages or warnings are displayed in View Log. For more information, see the Viewing the Messages.
For more information, see the Oracle Financial Services Analytical Applications Infrastructure User Guide.
To schedule a future validation, or to schedule validations on a recurring basis, follow these steps:
1. Navigate to Operations and select Batch Scheduler. The Batch Scheduler window appears.
2. In the Batch Name pane, select the Scheduled Batch ID. An unchecked box means that no validation is scheduled to run.
3. Select New Schedule or Existing Schedule.
The Existing Schedule can be selected only if there are existing schedule batches to view.
If New Schedule is selected, the New Schedule pane appears. Enter the Scheduled Task Name.
To schedule the validation on a recurring basis, select Daily, Weekly, Monthly, or Adhoc.
4. In the Schedule Task pane, enter the Start Date and End Date in the Date field.
5. In the Run Time field, enter the time for the next validation to be run.
6. Click Save to set the schedule as specified or Cancel to drop your changes.
Any error messages or warnings generated during the validation process are displayed in the View Log. For more information, see the Viewing the Messages.
For more information, see the Oracle Financial Services Analytical Applications Infrastructure User Guide.
Any error messages or warnings generated during the exchange rate validation process are displayed in the Log Information window.
To view the messages, follow these steps:
1. Navigate to Operations and select View Log.
2. Click the Task ID. The Log Information window will display.
These exception messages can also be seen in the FSI_MESSAGE_LOG table with the help of the batch_id which was used during execution.
An economic indicator is any economic statistic such as the Consumer Price Index (CPI), growth rate of the Gross Domestic Product (GDP), unemployment rate, Purchasing Managers Index, indices of consumer confidence, and so on. Such macroeconomic statistics tell us how well the economy has behaved in the past. Some economic indicators are referred to as lagging indicators while others are classified as leading indicators. Leading indicators can provide insights into the future direction of the economy.
OFSAA Rate Management's Economic Indicators module allows you to define and store such historical indicators. Economic Indicators provide baselines from which OFSAA Asset Liability Management can generate forecasts of future values of economic statistics that can affect new business or other modeling assumptions.
To view the Economic Indicators, navigate to Common Object Maintenance and select the Rate Management, and then select Economic Indicators, an empty window is displayed. After you have defined one or more Economic Indicators, the Economic Indicators Summary page shows all the Economic Indicators that you have previously built.
Figure 14: Economic Indicators Summary page
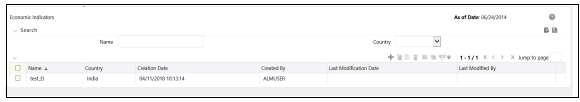
Description of Economic Indicators Summary page as follows
A Search pane is provided in which you can search for Economic Indicators by Name or Country. Each Economic Indicators rule is specific to one country.
To search the Economic Indicator, follow these steps:
1. Enter
search criteria and click the Search  icon.
icon.
2. Click
Reset icon to remove any Name or Country search criteria and
refreshes the window.
3. The search results are displayed in a tabular format containing all of the Economic Indicators that meet search criteria. The Economic Indicators Summary page offers several icons to perform different functions when an Economic Indicator is selected.
Table 15: Economic Indicator Summary page - Icons and Descriptions
Icon |
Description |
Add |
Click Add to begin the process of building a new Economic Indicator. The Add icon is disabled if any rows in the pane have been selected. |
View |
Select a single row out of the pane to enable the View. Click View icon to view the contents of an Economic Indicator on a read-only basis. The View icon is only enabled when a row has been selected. |
Edit |
Select a single row out of the pane to enable the Edit. Click Edit icon allows you to modify a previously saved Economic Indicator. The Edit icon is only enabled when a single row has been selected. |
Delete |
Select one or more rows out of the pane to enable the Delete. Clicking on the Delete deletes the Economic Indicators you have selected. |
Copy |
Select a single row out of the pane to enable the Copy. Click the Copy icon to create a copy of an existing economic indicator. The Copy icon is only enabled when a single economic indicator has been selected. |
Check Dependencies |
Select an Economic Indicator and then click the Check Dependencies icon to generate a report on all rules that utilize your selected economic indicator. The Check Dependencies is only enabled when a single economic indicator has been selected. |
Data Loader |
The Data Loader option executes a function to import historical economic indices for all defined Economic Indicators. For more information on setting up the automated process, see the Oracle Financial Services Analytical Applications Data Model Utilities User Guide. To execute a data load, click on the Data Loader. A warning message will appear Upload all available Economic Indicators? Click Ok, and all historical indices will be loaded. |
To select an Economic Indicator, select a check box in the first column of the pane. More than one Economic Indicators can be selected at a time but this will cause some of the icons to become disabled.
Select or deselect all of the Economic Indicators in the Economic Indicators Summary page by selecting the check box in the upper left-hand corner of the Summary page directly to the left of the Name column header.
The following columns categorize each Economic Indicator in the Summary page:
Table 16: Economic Indicator Summary page - Fields and Descriptions
Fields |
Description |
Name |
Displays the Economic Indicator's short name. Performing a mouse-over on a row within the pane displays the Economic Indicator's detailed description. |
Country |
Displays the Country to which an Economic Indicator applies. |
Creation Date |
Displays the Date and Time at which an Economic Indicator was created. |
Created By |
Displays the Name of the user who created an Economic Indicator. |
Last Modification Date |
Displays the Date and Time at which an Economic Indicator was last modified. |
Modified By |
Displays the Name of the user who last modified an Economic Indicator. |
When you Add, Edit, or View an Economic Indicator, the Economic Indicator Details window is displayed. The Economic Indicator Detail window includes an Economic Indicator Details pane, the Economic Indicators – Historical Data pane, and an Audit Trail pane.
The Audit Trail pane is a standard footer pane for every OFSAA rule type. It displays Created By, Creation Date, Last Modified By, and Modification Date on the Audit Trail pane. The User Comments tab can be used to add comments to any rule, subject to a maximum of 4000 characters.
To add an Economic Indicator, follow these steps:
1. Click
Add
from the Economic Indicator Summary page.
Figure 15: Adding a new Economic Indicator
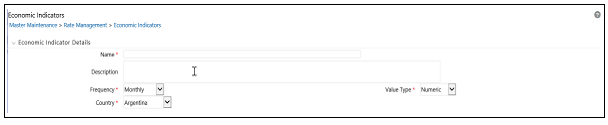
Description of Economic Indicators window as follows
2. Enter the following information in the Economic Indicator Details window as tabulated
Table 17: Create a new Economic Indicator – Fields and Descriptions
Fields |
Description |
Name |
The name to your Economic Indicator is how you will subsequently refer to your rule within other the OFS Analytical Applications. You can not rename existing Economic Indicators. |
Frequency |
The frequency of your Economic Indicator must match the frequency which with the indicator's data is made public. Unemployment statistics, for example, are generally released on a monthly frequency. Select a frequency from the Frequency drop-down list. Available frequencies are Weekly, Monthly, Quarterly, Semi-Annually, and Annually. |
Value Type |
Select a Value Type from the Value Type drop-down list. Available Value Types are Numeric, Percentage, and Amount. Numeric 0-999999 Percentage -100 to +100 Amount 0-999999 |
Country |
Select a country to which your Economic Indicator applies from the Country drop-down list. The value set of Countries is drawn from the seeded Country dimension. OFSAA is seeded with over 70 country values, and you can add user-defined countries. |
3. Click Save. To build out your historical data, enter data within the Economic Indicators – Historical Data pane.
4. The Economic Indicators – Historical Data pane displays a single blank row followed by the most recent period's data (if data has previously been stored in the database).
Figure 16: Economic Indicators – Historical Data section on Economic Indicator window
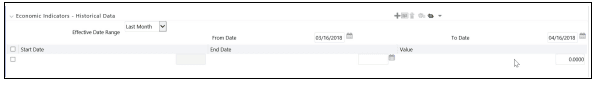
Description of Economic Indicators – Historical Data section on Economic Indicator window as follows
Table 18: Economic Indicators – Historical Data section – Fields and Descriptions
Fields |
Description |
Start Date and End Date |
Select the Calendar |
Value |
Enter the value for your Economic Indicator (such as the unemployment rate). |
Adding Multiple Data Points |
Click Add
|
Editing Economic Indicators – Historical Data |
Select a single check box
on the left-hand side of any row to enable the Edit.
Clicking Edit |
Viewing Economic Indicators – Historical Data |
By default, the Economic Indicators – Historical Data pane displays the most recent month of historical data. You can restrict the amount of data displayed by selecting a different value from the Effective Date Range drop-down list. You can also choose to view a specific date range by modifying the From Date, To Date, or both dates within the Economic Indicators – Historical Data pane. |
Deleting Economic Indicators – Historical Data |
Select one or more check boxes on the left-hand side of any row to enable the Delete icon. After clicking Delete, a confirmation message is displayed to delete the selected rows. |
Data Loader |
The Data Loader option executes a function to import historical economic indicators for all defined economic indicators. For more information on setting up the automated process, see the Oracle Financial Services Analytical Applications Data Model Utilities User Guide. To execute a data load, click the Data Loader. A warning message will appear Upload all available Economic Indicators? Click Data Loader to execute all the Economic Indicators. |
Excel Import/Export |
Use Excel Import or Export functionality to add or edit Historical Economic Indicators. |
 )
) )
) )
)