This chapter provides the details of OFS HM reports.
Topics
Fair Valuation Management Reports
The Fair Value Summary Dashboard consists of the following reports:
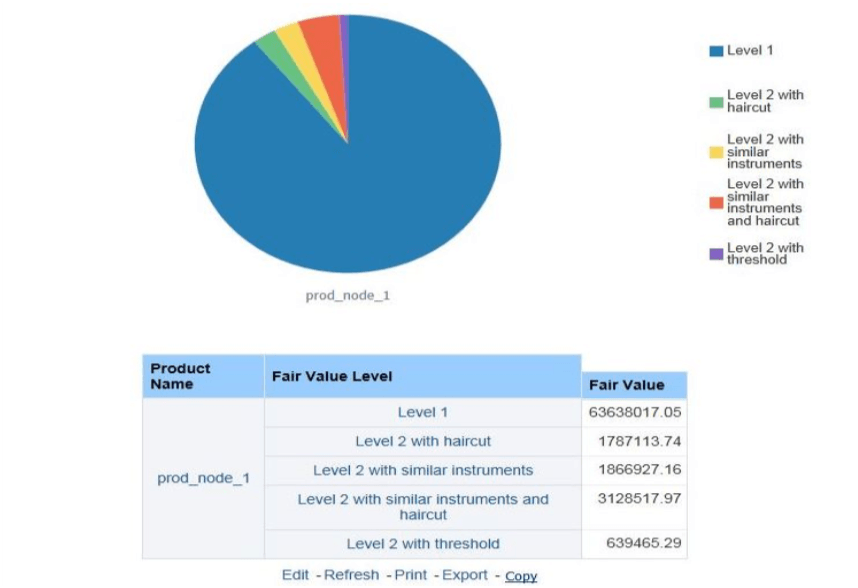
This report uses a Pie Chart to depict the Fair value of various products with the details such as Product Name, Fair Value Level (Level 1, Level 2, or Level 3), and Fair Value as of the selected Execution Date.
Figure 16: The Fair Value By Product Report
You can click on the Pie Chart to view the report details such as Account Number, Fair Value Level Method, Market Value, Iso Currency Code, and Market Value-Reporting Currency.
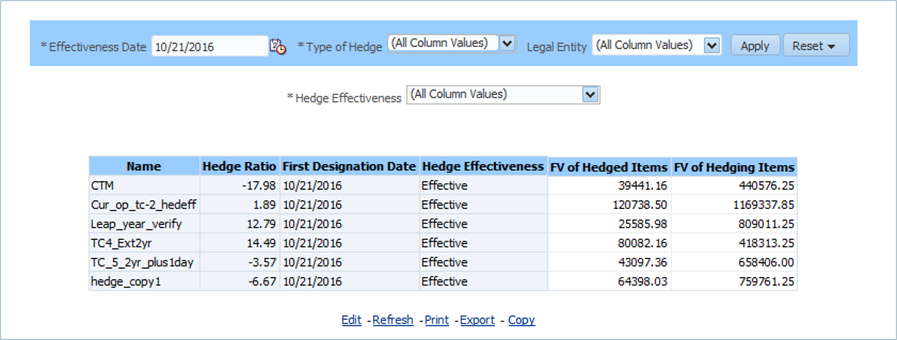
The Disclosure Reports display the effectiveness details of various Hedges as on the selected Effectiveness Date. The details include Hedge Name, Hedge Ratio, First Designation Date, Hedge Effectiveness, FV of Hedged Items, and FV of Hedging Items.
Figure 17: The Disclosure Report
The Disclosure - 23 B(a) Dashboard consists of the following report:
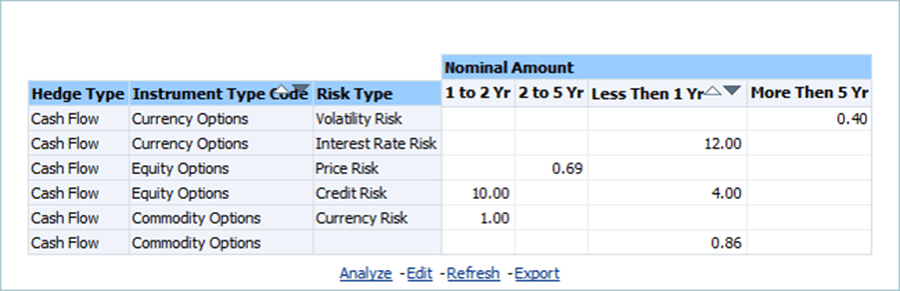
This report displays the Nominal Amount in less than one year and one to two years for various Hedge Types, Instrument Type Codes, and Risk Types.
Figure 18: The Disclosure – 23 B (a) Report
The Disclosure - 24 A Dashboard consists of the following report:
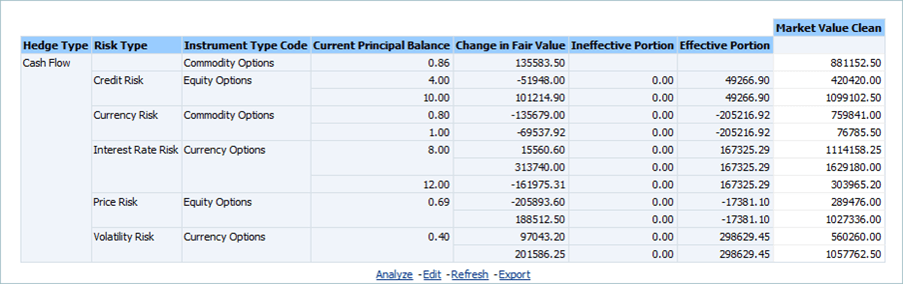
This report calculates the Fair Value for various Hedge Types using the parameters such as Risk Type, Instrument Type, Change in Fair Value, Effective Portion, Ineffective Portion, and Nominal Amount.
Figure 19: The Disclosure – 24 A Report
The Fair Valuation Management Reports Dashboard consists of the following report:
· Fair Value Management Report
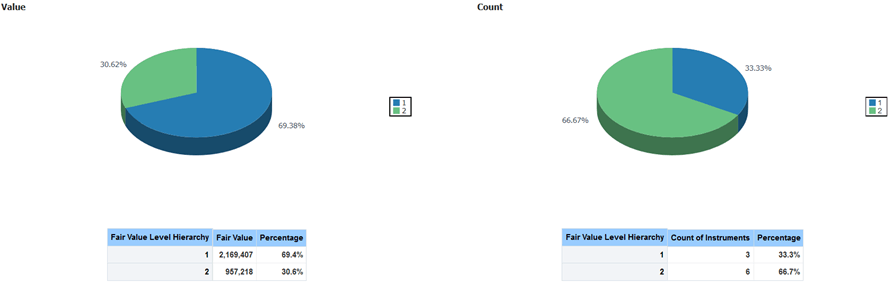
This report displays two different pie charts for Value and Count. The Value report displays the percentage of Fair Value for different levels of Fair value.
The Count report displays the number of instruments and distribution percentages.
Both Value and Count reports also displays the details in tables.
Figure 20: The Fair Value Management Report
The Hedge Management Report Dashboard consists of the following reports:
This report displays the Gain or Loss values of all hedged items in a given Hedge.
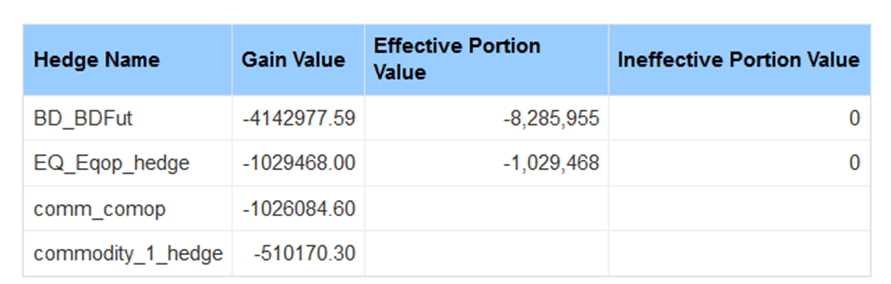
This report displays the Gain or Loss values, Effective Portion Value, and Ineffective Portion Value for all Hedging Instruments across various Hedges.
The following report displays both Hedged Items and Hedging Instruments.
Figure 21: The Hedging Instruments Report
The Hedge Effectiveness Report Dashboard consists of the following reports:
· Hedge Effectiveness based on Parameters
· Economic Relationship Detail Report
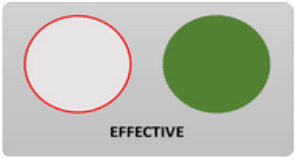
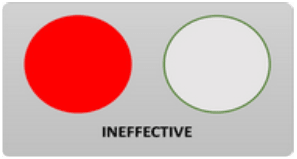
This section of the report indicates whether the Hedge is effective or not.
Effectiveness is as shown in the following figure.
Figure 22: The Overall Hedge Effectiveness Section
Ineffectiveness is as shown in the following figure.
Figure 23: The Overall Hedge Effectiveness Section
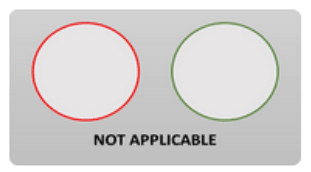
Not Applicable is as shown in the following figure.
Figure 24: The Overall Hedge Effectiveness Section
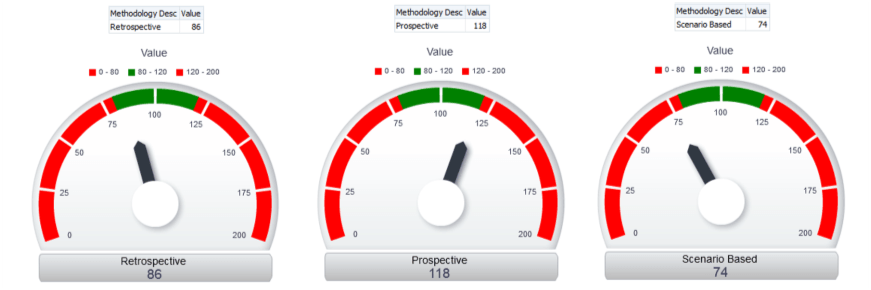
This section of the report displays the Hedge Effectiveness or Ineffectiveness based on the Quantitative and Qualitative parameters such as Critical Terms Match, Hedge Ratio, Economic Relationship, and Credit Risk Dominance.
This report displays the Retrospective value of Economic Relationship, as depicted in the following section.
This report displays the Retrospective value of the Hedge Ratio, as depicted in the following figure.
The following diagram displays the Economic Relationship Detail and Hedge Ratio Detail report.
Figure 25: The Hedge Ratio Detail Report