
DIH provides built-in facilities for you to analyze details of data movement operations performed under its auspices. The following sections provide details on how this may be accessed and used. Also, DIH provides information on the utilization of the data model in use, split by applications deployed. Utilization information also covers Application Data Interfaces and Connectors.
Topics:
· Utilizing Available Artifacts
Execution History provides the status of Connector executions, covering details of volume, outcome, and performance.
To view the Execution History of a Connector, follow these steps:
1. From the Data Integration Hub Designer window, select Analyse, and then select Execution. The Execution window is displayed. The Connectors are listed in the sequence of their last execution. It also provides information on the following.
§ Number of records loaded in the last execution
§ Duration
§ Total Controls defined for all EDDs in the connector
§ Number of controls breached for the last execution
§ Average Duration
§ Average Records
§ Frequency
NOTE:
The frequency is classified as Daily, Weekly, Monthly, Bi-Monthly, and Quarterly. This value is decided automatically depending on the frequency of the connector execution in the specified environment.
Figure 87: Execution Window

2. You can view
the summary details of all the connectors that are executed in either
the Execution Report  or
Performance View
 to view the connector performance heat map.
Figure 88: Execution Performance View
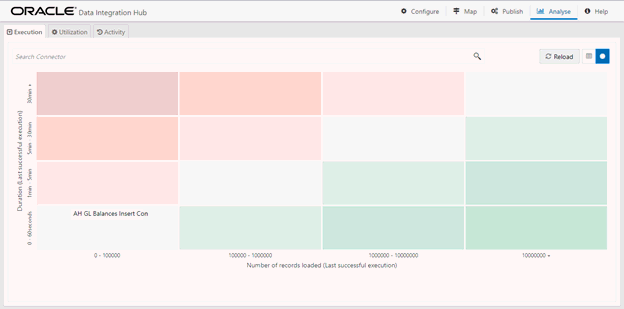
3. The search bar helps you to find the connector for which you can view the executions. You can enter the nearest matching keywords to search and filter the results by entering information on the search box. You can search for a connector using either the name or description.
4. Click the required Connector under Execution History.
5. Select the Batch Run ID from the drop-down list to view the executions. You can view the Data Load information.
Figure 89: Execution Window
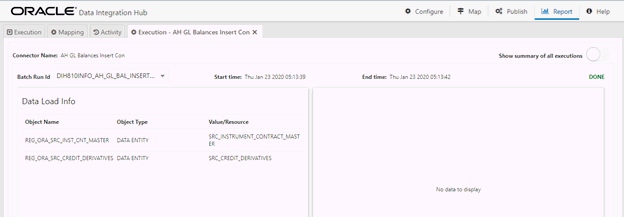
6. To view the summary of all executions, select Show summary of all executions.
Figure 90: Execution Summary Of All Executions

7. Here you can view the number of records loaded, duration, start time, end time, and the status of the last execution.
NOTE:
Due to limitations in ODI, the number of records while loading data into Hive might display as zero.
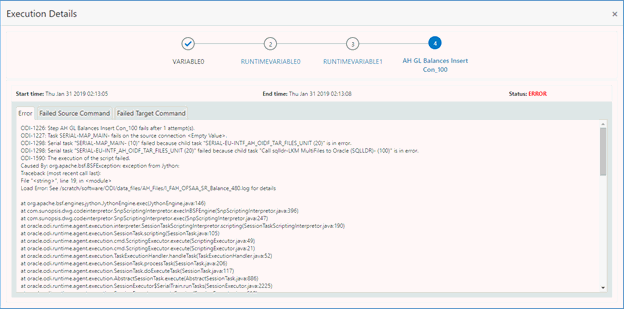
8. If the status displays as Error, click the link to view details about the execution. The error details failed source command and failed target command is displayed.
Figure 91: Execution Details
9. If you wish
to see the detailed execution report, click Download
Log  . A zip file is downloaded containing
the detailed log for the execution.
10. To view the log details, extract the log file from the zip folder.
11. If the control definition is defined for file type EDD, the report of the expected and actual results loaded is displayed.
12. Click  to view
the report for the required connector.
Figure 92: Connector Report
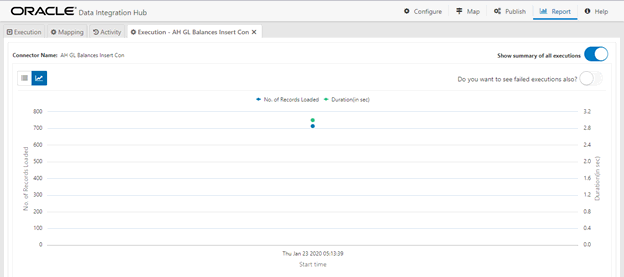
13. If you wish to view the failed executions, select “Do you want to see failed executions also?”
To analyze the utilization of data model, ADI, and Connectors, follow these steps:
1. From the Data Integration Hub Designer window, select Analyse and then select Utilization to view the Mapping Report for the ADI and Connectors.
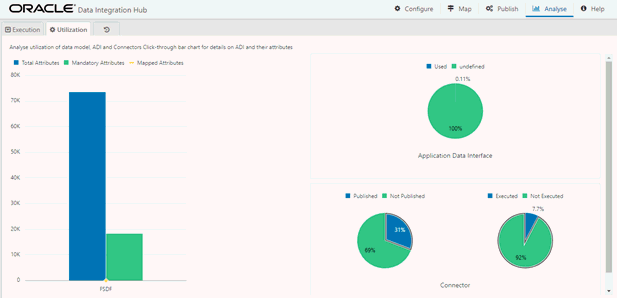
2. The Utilization window displays the graph of total attributes, mandatory attributes, mapped attributes along with Connector details.
Figure 93: Utilization Window
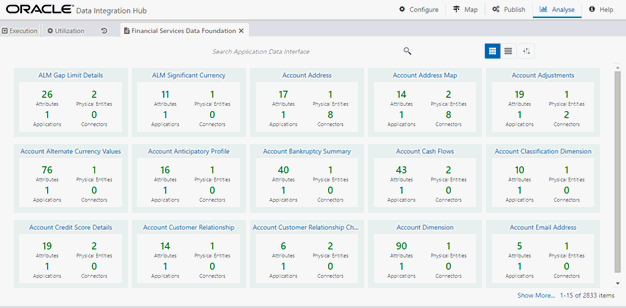
3. Click Total or Mandatory or Mapped Attribute graph. This opens the ADI Summary window.
Figure 94: ADI Summary Window
4. Select the required ADI. The Mapping Report window is displayed. This displays the number of attributes mapped for the ADI (subtype) in each connector created for the same.
Figure 95: Mapping Report
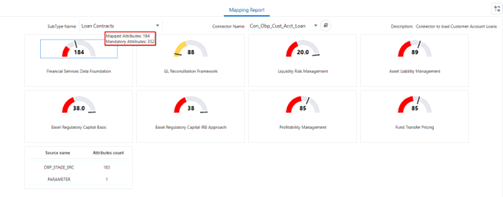
Figure 96: Mapping Report
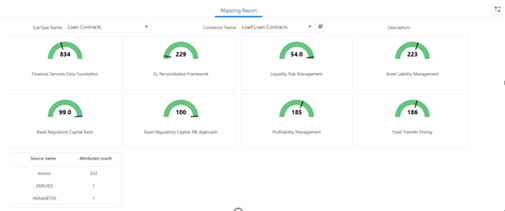
5. Select the Connector Name from the list of connectors, which are populating that particular ADI.
6. Depending on the connector and subtype you select, the attribute report is displayed.
7. The report displays the total number of mapped attributes and a total number of mandatory attributes for that particular application.
§ Mapped attributes which are less than mandatory attributes display in Red.
§ Mapped attributes which are greater than mandatory attributes display in Yellow.
§ Mapped attributes are the same as the total number of attributes displayed in Green.


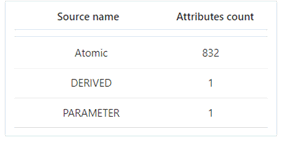
It also displays the EDS name, the number of attributes sourced from that particular EDS.
8. Click  to
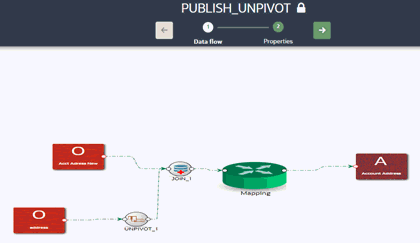
View Connector.

Figure 97: Publish Unpivot
1. From the Data Integration Hub Designer window, select Analyse,
and then select . The Analyze Activity
window is displayed.
Figure 98: Analyze Activity

2. You can analyze activities undertaken through DIH over a maximum range of three calendar days. You can view the activities of any creation, update, and deletion of the metadata. You can view the publish/unpublish or refresh activity in this window.
3. In From and To fields, select Date and
Time and click  Fetch
info to view the results.