Oracle Financial Services Insurance Accounting Analyzer application includes pre-packaged reports, which cater to disclosure requirements under IFRS 17. It also includes reports, which are created to help management in strategic decisions. All the disclosure reports can be exported to different formats like PDF, CSV, Excel, and so on. All the reports are segregated in the following three Dashboards:
· Dedicated Disclosure Reports
· Projection of Contractual Service Margin
· Analytical Reports and Trend Reports
The IFRS 17 guidelines lay specific emphasis on disclosure of key financial data while keeping the scope open on what constitutes an appropriate disclosure. The Application has a range of disclosure reports to track the Movement Analysis, Reconciliations, and Statement of Accounts.
The projection of Contractual Service Margin displays the projection as calculated based on the input variables and other parameters to extrapolate the output for the contract duration.
The Analytical and Trend Reports help in identifying the Onerous or Non Onerous contracts for the different legal entities within an organization and other parameters that allow the Management in strategic decision making.
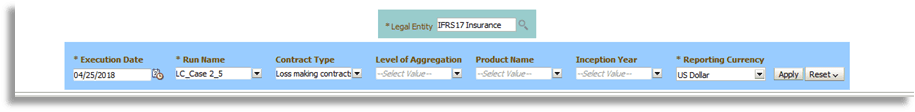
The Dashboards have a set of filters, which allow the users to access the specific information for the reports viewed and reported. The filters are Legal Entity, Reporting Date, Liability Calculation Run, and so on. In addition to the filters, users can view the reports in a specific reporting currency.
Figure 65: The Dashboard Filters
The following are the reports available as part of the Oracle Insurance Accounting Analyzer Release version 8.1.0.0.0.
This section details the disclosure reports that are a part of the Oracle Financial Insurance Accounting Analyzer application.
This section details the GMM Liability Analysis reports. It includes Movement Analysis, Reconciliation – Remaining Coverage, Insurance Revenue Details, and Statement of Profit or Loss.
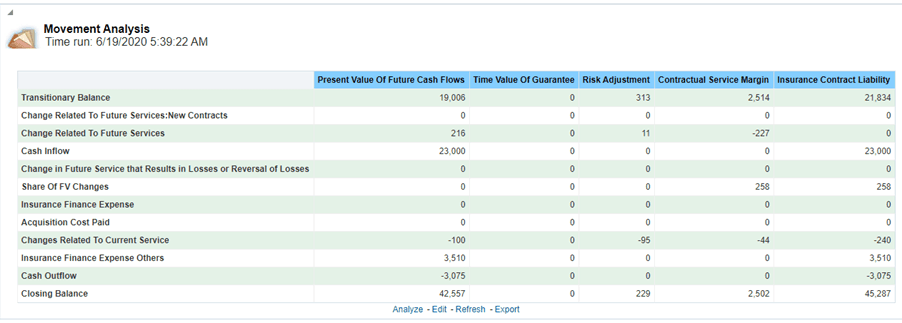
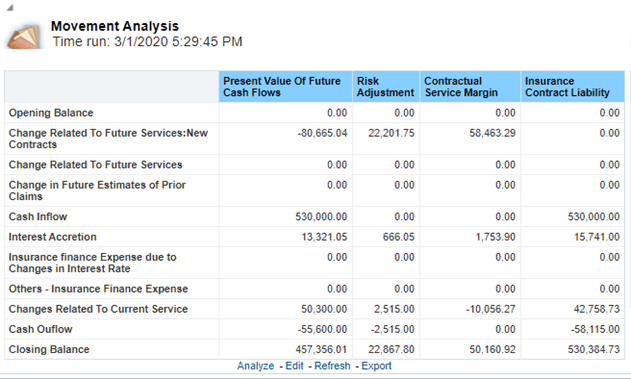
Depending on the run that you execute (Normal or Transition), this report provides a detailed analysis of changes or movements in insurance liabilities, during the coverage period of contracts under the General Measurement Model.
Figure 66: The Movement Analysis Report from a Normal Run
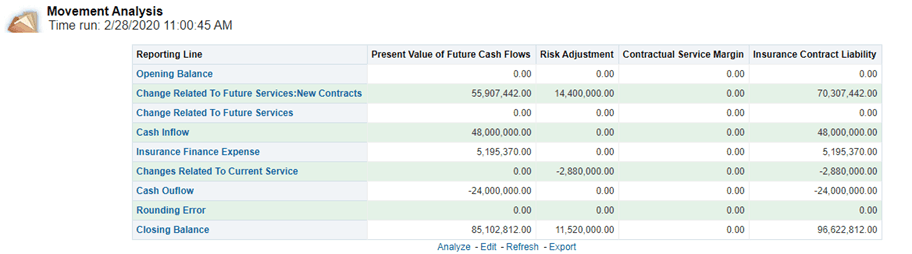
Figure 67: The Movement Analysis Report from a Transition Run
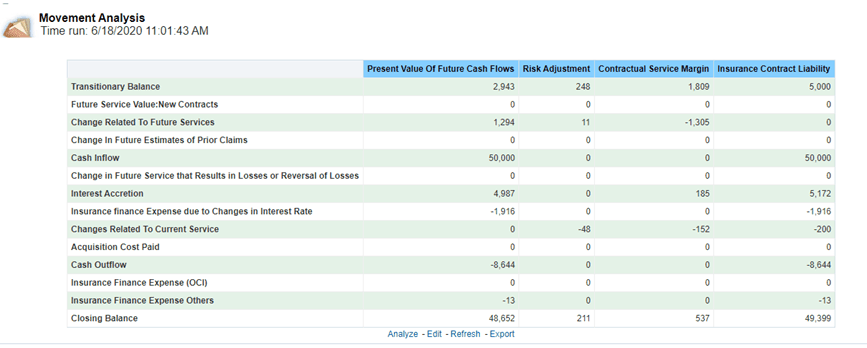
Figure 68: The Movement Analysis Report
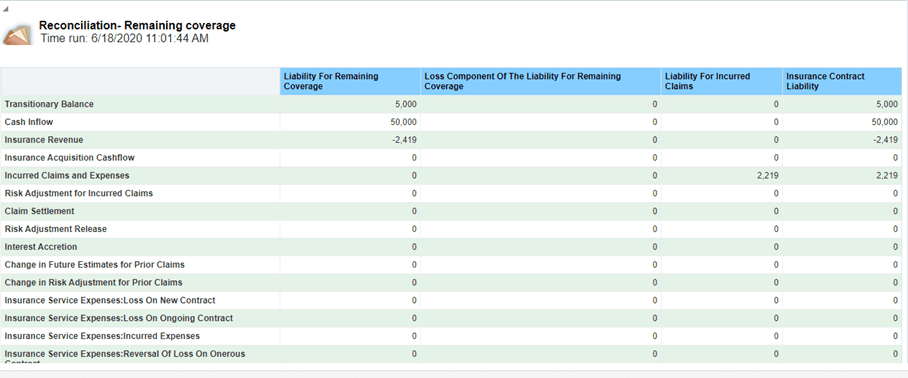
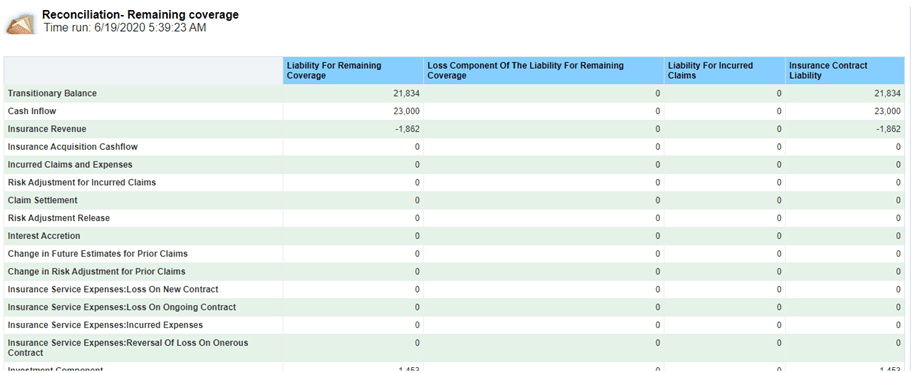
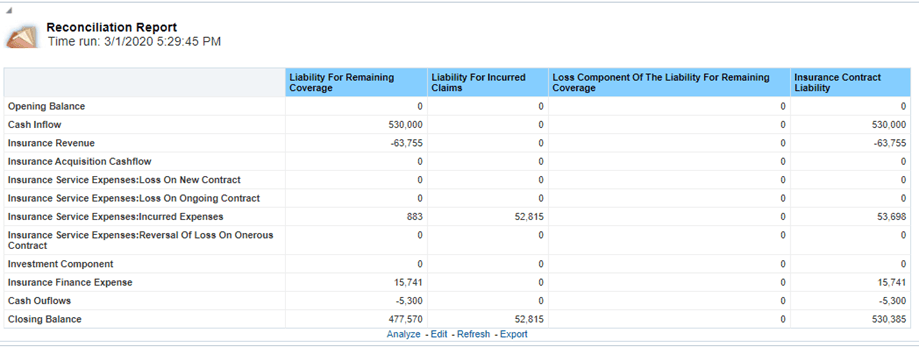
Depending on the run that you execute (Normal or Transition), this report helps in reconciling the data derived from the calculation of CSM or net liability under the General Measurement Model.
Figure 69: The Reconciliation – Remaining Coverage Report from a Normal Run

Figure 70: The Reconciliation – Remaining Coverage Report from a Transition Run
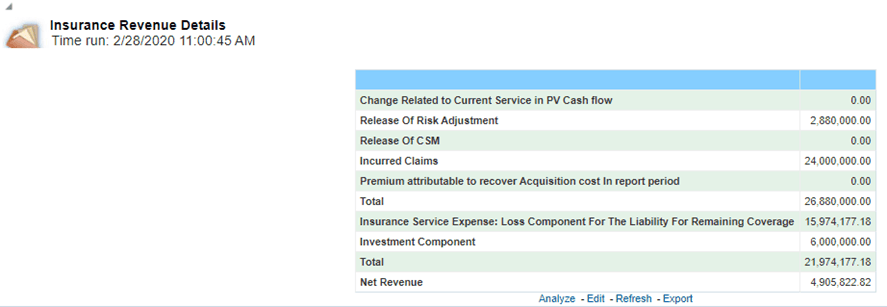
This report helps in reconciling the data derived from the calculation of CSM or net liability under the General Measurement Model.
Figure 71: The Insurance Revenue Details Report
This report displays the profit and losses that are generated by insurance services and investments for a selected reporting period.
Figure 72: The Statement of Profit or Loss Report

This section details the VFA Liability Analysis reports. It includes Movement Analysis, Reconciliation – Remaining Coverage, and Statement of Profit or Loss.
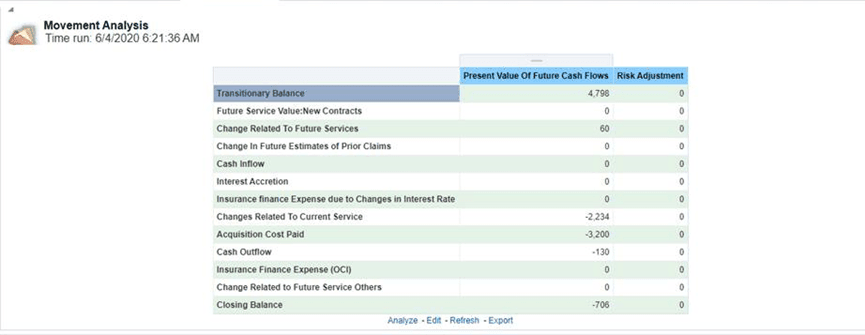
Depending on the run that you execute (Normal or Transition), this report provides a detailed analysis of changes or movements in insurance liabilities, during the coverage period of contracts under Variable Fee Model.
Figure 73: The Movement Analysis Report from a Normal Run
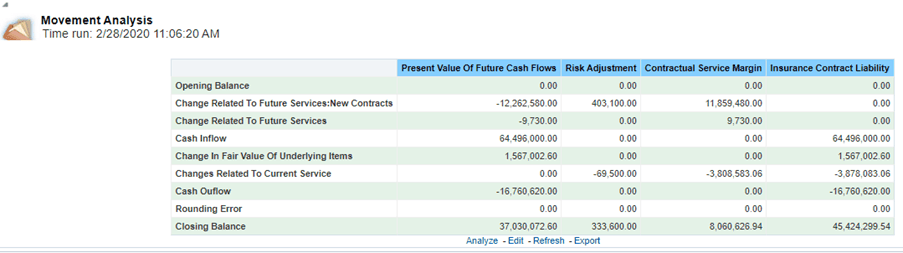
Figure 74: The Movement Analysis Report from a Transition Run
Depending on the run that you execute (Normal or Transition), this report helps in reconciling the data derived from the calculation of liability under VFA.
Figure 75: The Reconciliation – Remaining Coverage Report from a Normal Run
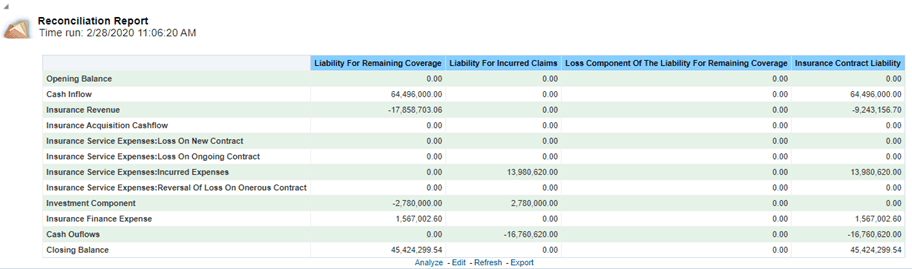
Figure 76: The Reconciliation – Remaining Coverage Report from a Transition Run
This report displays the profit and losses that are generated by insurance services and investments for a selected reporting period.
Figure 77: The Statement of Profit or Loss Report

This section details the PAA Liability Analysis reports. It includes Movement Analysis, Liability Analysis, Liability For Incurred Claims, and Statement of Profit or Loss.
Depending on the run that you execute (Normal or Transition), this report provides a detailed analysis of changes or movements in insurance liabilities and transitionary balance, during the coverage period of contracts under the Premium Allocation Approach.
Figure 78: The Movement Analysis Report from a Normal Run

Figure 79: The Movement Analysis Report from a Transition Run
Depending on the run that you execute (Normal or Transition), this report provides a detailed analysis of changes or movements in insurance liabilities and transitionary balance during the coverage period of the contract, under the Premium Allocation approach.
Figure 80: The Liability Analysis Report from a Normal Run
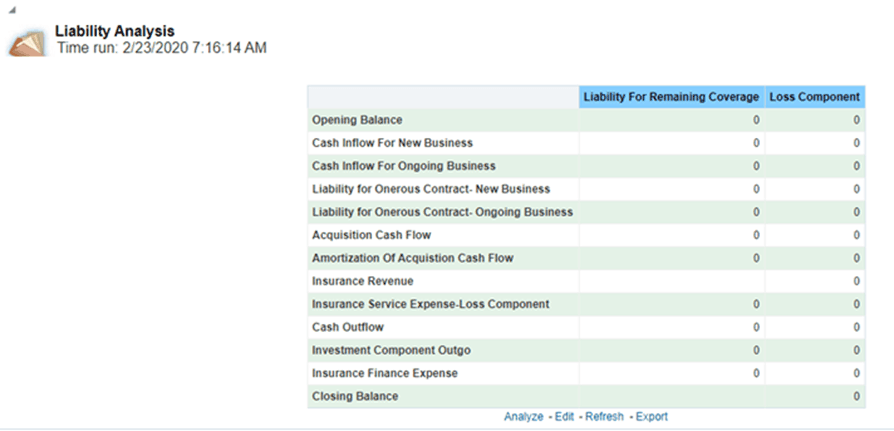
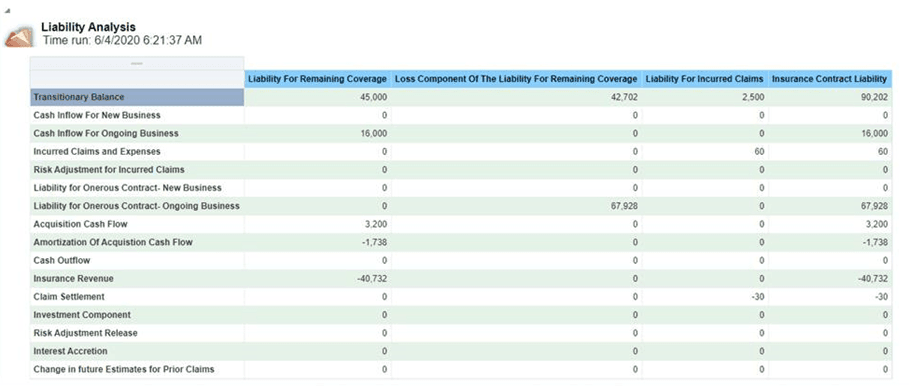
Figure 81: The Liability Analysis Report from a Transition Run
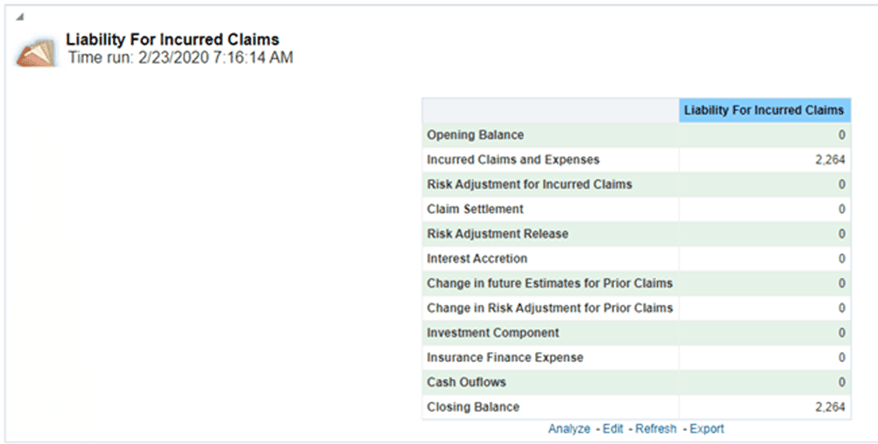
This report provides details on the liability for incurred claims under the Premium Allocation Approach.
Figure 82: The Liability For Incurred Claims Report
This report displays the revenue and expenses which are generated by insurance services and investment in the reporting period. This is taken forward to the Profit and Loss statement under the Premium Allocation approach.
Figure 83: The Statement of Profit or Loss Report

This section details the CSM Projection report.
This report displays the reports CSM or Loss Projection for the future period in tabular as well as graphical format.
Figure 84: The CSM Projection Report

This section details the Reinsurance GMM Liability Analysis reports. It includes Reinsurance Movement Analysis, Reinsurance Reconciliation Report, and Reinsurance Financial Statement reports.
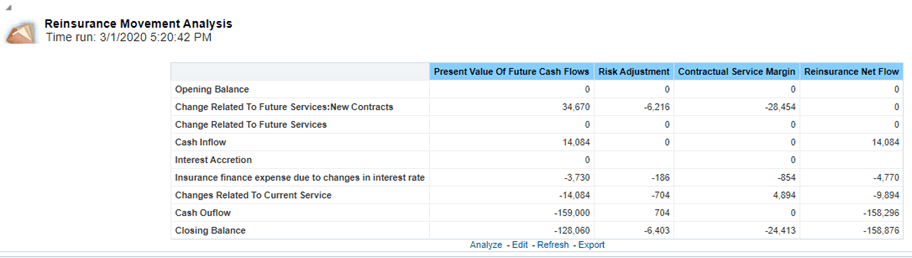
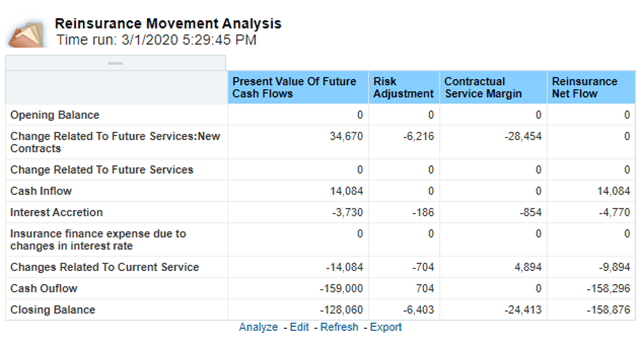
This report gives a detailed analysis of the present value of future cash flows, risk adjustment, contractual service margin, and reinsurance net flow.
Figure 85: The Reinsurance Movement Analysis Report
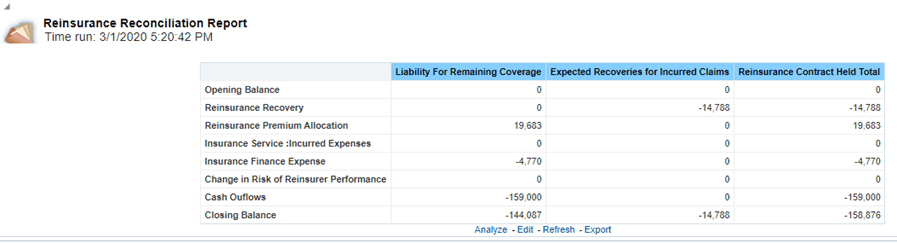
This report gives a detailed analysis of the liability for remaining coverage, expected recoveries for incurred claims, and reinsurance contract held total for the reinsurance reconciliation reports.
Figure 86: The Reinsurance Reconciliation Report
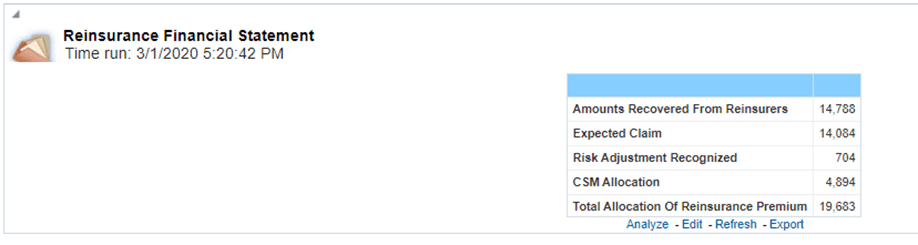
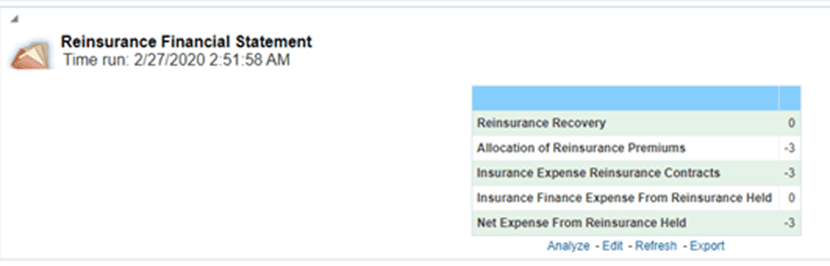
This report gives a detailed analysis of the reinsurance financial statements.
Figure 87: The Reinsurance Financial Statement Report
This section details the Reinsurance PAA Liability Analysis reports. It includes Reinsurance Held Liability Analysis, Reinsurance Held Liability Analysis Incurred Claims, and Reinsurance Financial Statement reports.
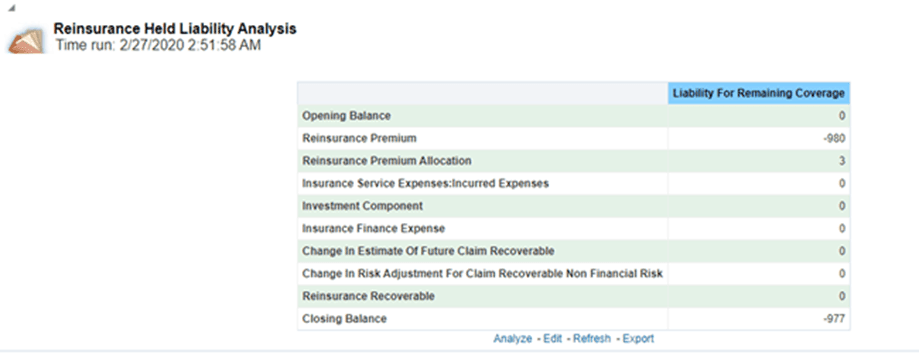
This report gives a detailed analysis of the liability for remaining coverage.
Figure 88: The Reinsurance Held Liability Analysis Report
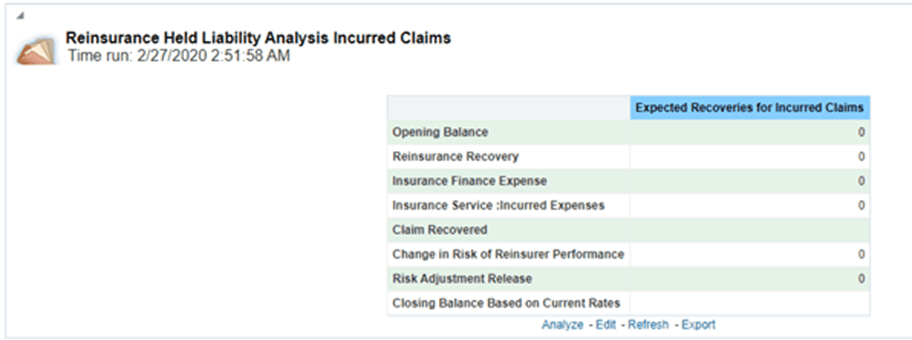
This report gives a detailed analysis of the expected recoveries for incurred claims.
Figure 89: The Reinsurance Held Liability Analysis Incurred Claims Report
This report gives a detailed analysis of the reinsurance financial statement.
Figure 90: The Reinsurance Financial Statement Report
This section details the Comparison reports. It includes Movement Analysis, Reinsurance Movement Analysis, Reconciliation Report, and Statement of New Profit or Loss.
This report compares the movement analysis of the corresponding direct insurance estimates for a selected method.
Figure 91: The Movement Analysis Report
This report compares the liability analysis of the reinsurance held liability analysis with the corresponding direct insurance estimates for a selected method.
Figure 92: The Reinsurance Movement Analysis Report
This report compares the reconciliation of movement analysis of the direct insurance liability analysis with the corresponding reinsurance held estimates for a selected method.
Figure 93: The Reconciliation Report
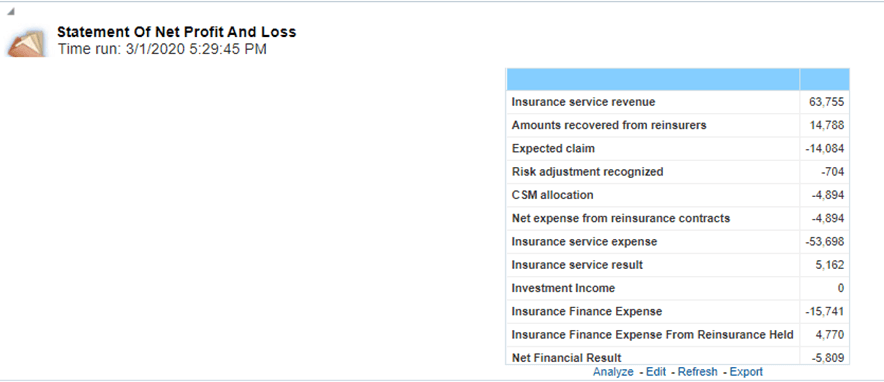
This report compares the statement of net profit and loss of the direct insurance liability analysis with the corresponding reinsurance held estimates for a selected method.
Figure 94: Statement of Net Profit and Loss Report
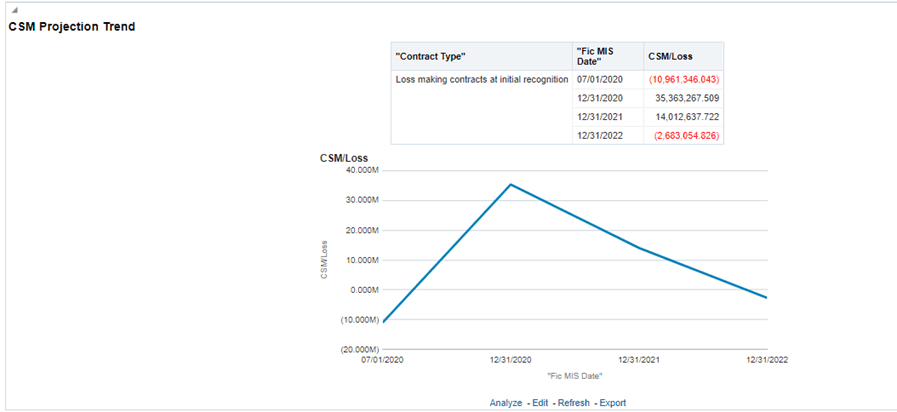
This report displays a detailed analysis of the CSM projection trend.
Figure 95: The CSM Projection Trends Report
This section details the Summary of Contract Groups report.
This report provides a detailed analysis of the LOB, legal entity, number of contracts, and loss-making contracts at initial recognition for a contract group.
Figure 96: The Summary of Contract Groups Report

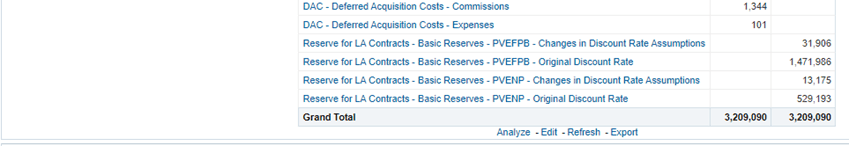
This section details the Sub Ledger reports. It includes Ledger Closing Balances and Journals – Event View reports.
This report displays the Debit Value and Credit Value for the GL Accounts like Cash, Deferred Acquisition Cost, Insurance Contract Liabilities (BEL, CSM, and RA), and so on.
Figure 97: The Ledger Closing Balances Report
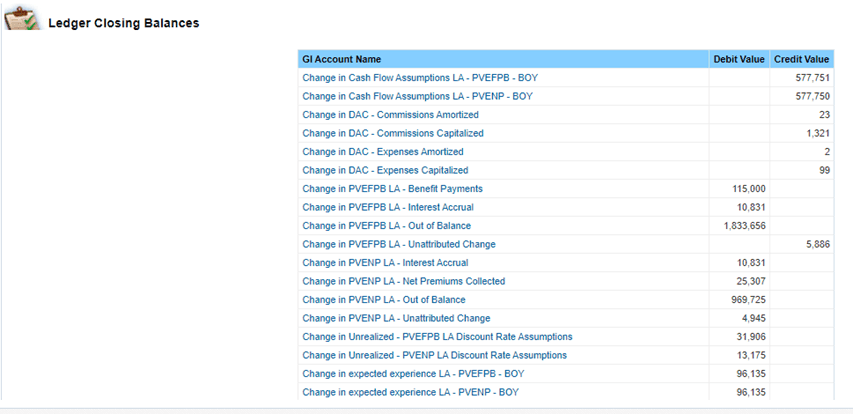
Figure 98: The Ledger Closing Balances
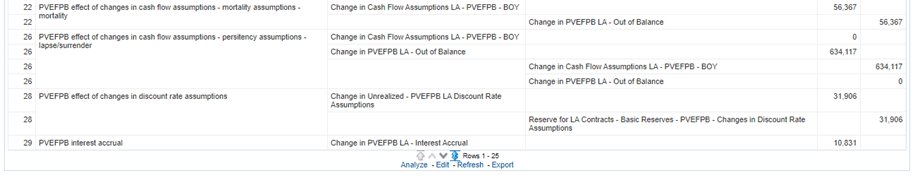
This section details the Journals – Event View report.
Figure 99: The Journals - Event View Report
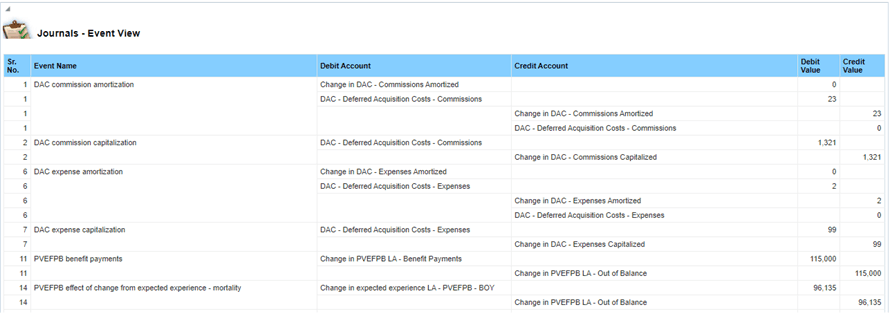
Figure 100: The Journals Even View Report
This section details the list of Long Duration Contracts Reports.
This section details the Disclosure reports for the Long Duration Contracts.
This report provides a detailed analysis of the present value of the expected net premiums, expected future policy benefits, and the net liability for future policy benefits during the coverage period for long-duration contracts.
Figure 101: The Disclosure of Information about the Liability for Future Policy Benefits LFPB RF Report
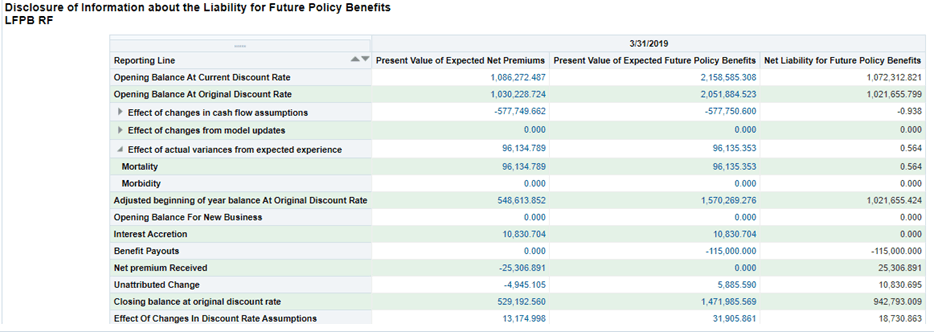
Figure 102: The Disclosure of Information about the Liability for Future Policy Benefits LFPB RF Report

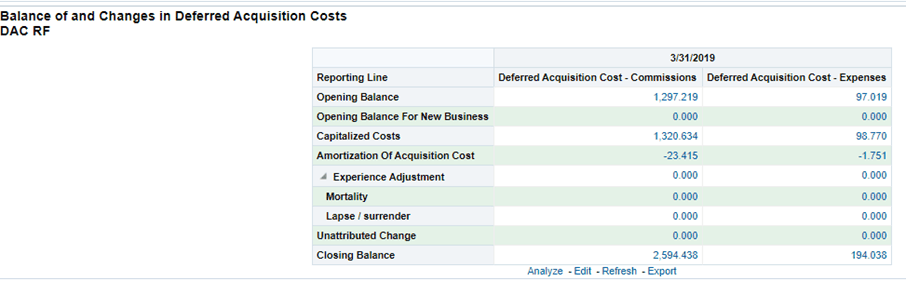
This section details the Balance of and Changes in Deferred Acquisition Costs DAC RF report.
This report provides a detailed analysis of the deferred acquisition cost of commissions and expenses during the coverage period for long-duration contracts.
Figure 103: The Balance of and Changes in Deferred Acquisition Costs DAC RF Report
This section details the Present Value of Expected Net Premium report.
This report provides a detailed analysis of the debit and credit values of the GL account for a specific event during the coverage period for long-duration contracts.
Figure 104: The Present Value of Expected Net Premium Report

Figure 105: The Present Value of Expected Net Premium Report
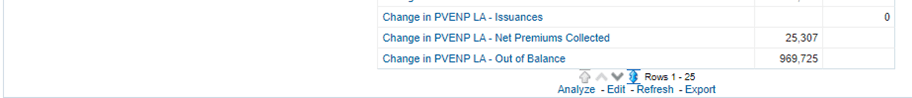
This report provides a detailed analysis of the debit and credit values of the GL account during the coverage period for long-duration contracts.
Figure 106: The Ledger Closing Balances Report
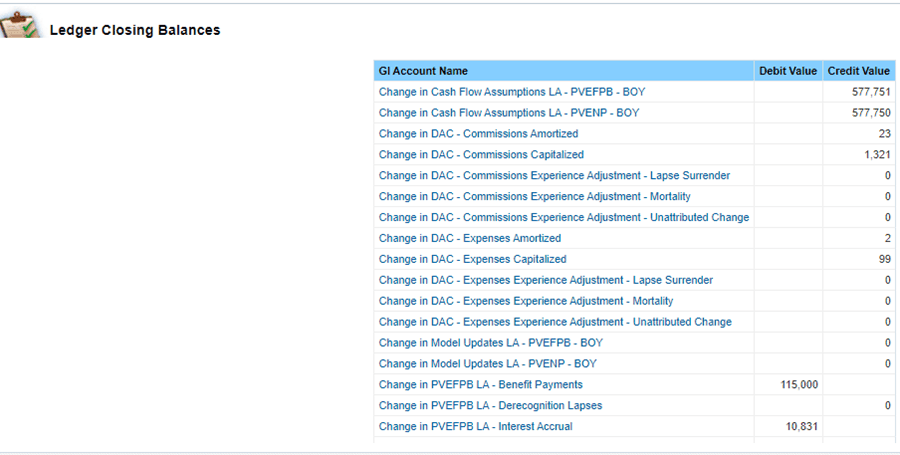
Figure 107: The Ledger Closing Balances Report
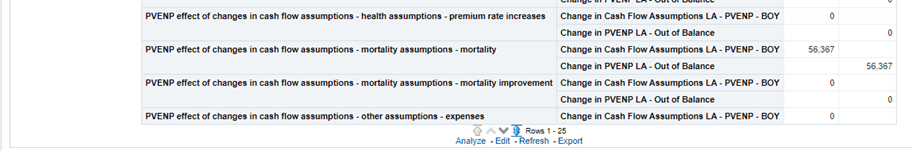
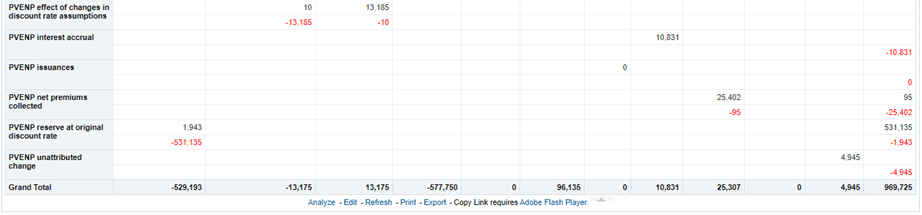
This section details the Present Value of Expected Net Premium report.
This report provides a detailed analysis of the various value of the net premiums of the GL accounts for a specific event during the coverage period for long-duration contracts.
Figure 108: The Present Value of Expected Net Premium Report
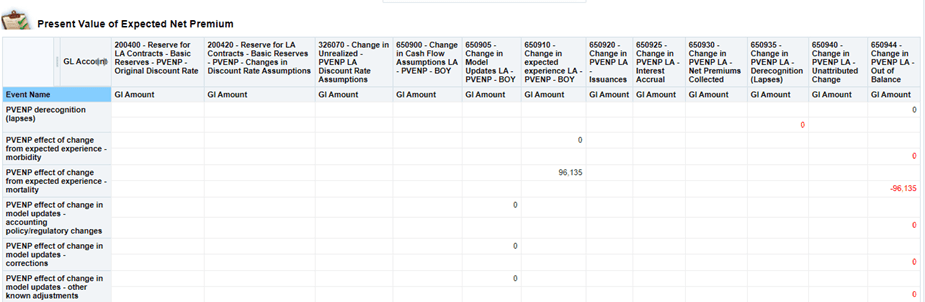
Figure 109: The Present Value of Expected Net Premium Report

Figure 110: The Present Value of Expected Net Premium Report
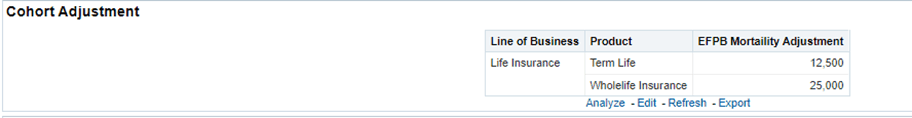
This section details the Cohort Adjustment report.
This report provides a detailed analysis of the cohort adjustment for a LOB during the coverage period for long-duration contracts.
Figure 111: The Cohort Adjustment Report