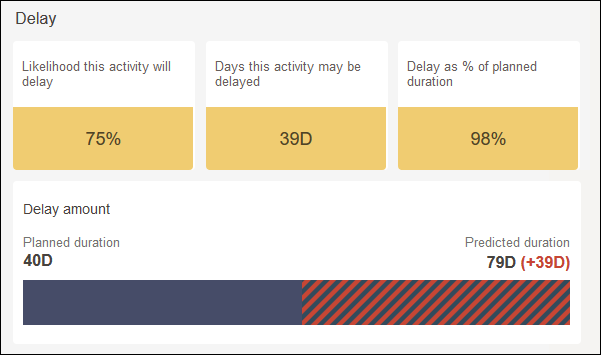
The Delay section of the Individual Activity Detail page displays the likelihood of delay of an activity in terms of days and percentages as a part of the planned duration of the project.
The Delay Amount graph displays the extent of activity delay as follows:
- The original planned duration is displayed as a solid blue area. In the above example, 40 days.
- The number of days the schedule is predicted to be delayed is displayed by the red striated area. In the above example, the predicted delay is 39 days.
- The red-and-grey striated area displays the total predicted duration of the activity. In the above example, the total predicted duration is 79 days.