Documents on your Project Section
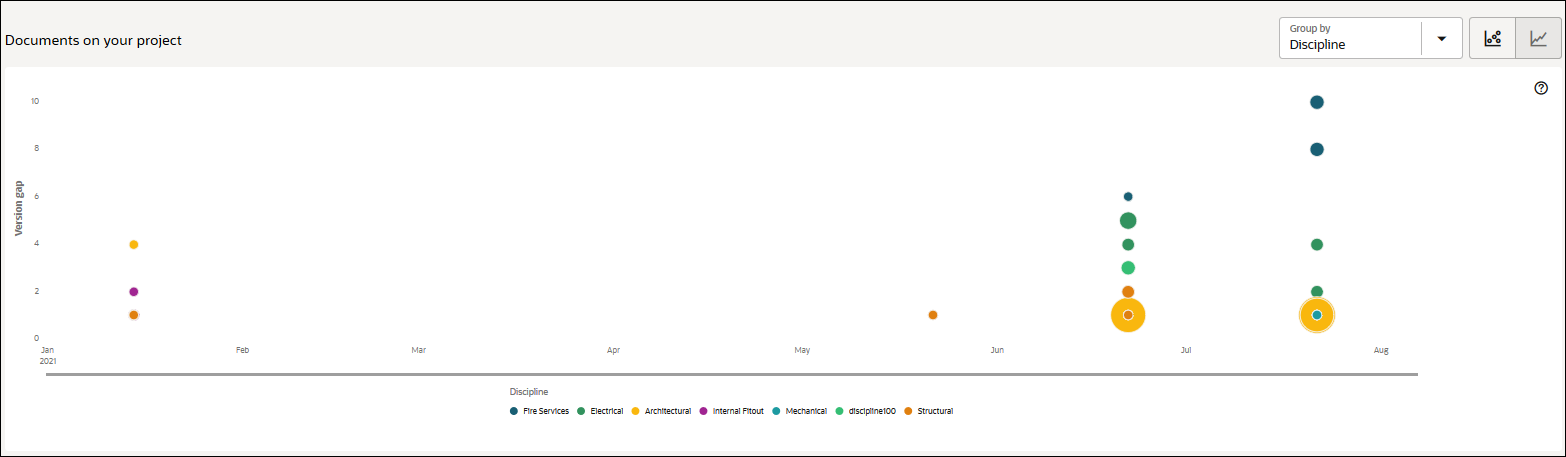
Documents on your Project: You can review tUse the bubble chart to glean information about the risks discovered from outdated documents each month as follows:
- Each bubble refers to an outdated document.
- The size of the bubble indicates the extent to which the document was transmitted and shared between organizations.
If the document was shared extensively between organizations, the size of the bubble increases proportionately, and represents greater risk.
- The color of the bubble indicates the discipline associated with each document.
For example, Blue represents design documents associated with the discipline of Architecture.
- The position of the bubble is indicative of the average number of versions a document is outdated. Therefore, the higher a bubble is positioned, the greater the number of versions on average the document is outdated.
The X-axis represents the month in which the risk was discovered and the Y-axis represents the version gap between the version in the document register and the latest transmitted version.
Select any of the following actions to view more information from the graph:
- Use the Group By list to view the graph for a specific Discipline, Document Type, or Document Status
- Hover over a bubble to view more details about an outdated document.
- Select a Line Graph
 or a Bubble Graph
  to view the outdated documents
Note: The threshold settings of the risk totals can be modified in the CIC Advisor Administration application. To modify the risk thresholds to suit your organization standards, contact your CIC Advisor administrator.
Related Topics
Last Published Tuesday, December 24, 2024