Description
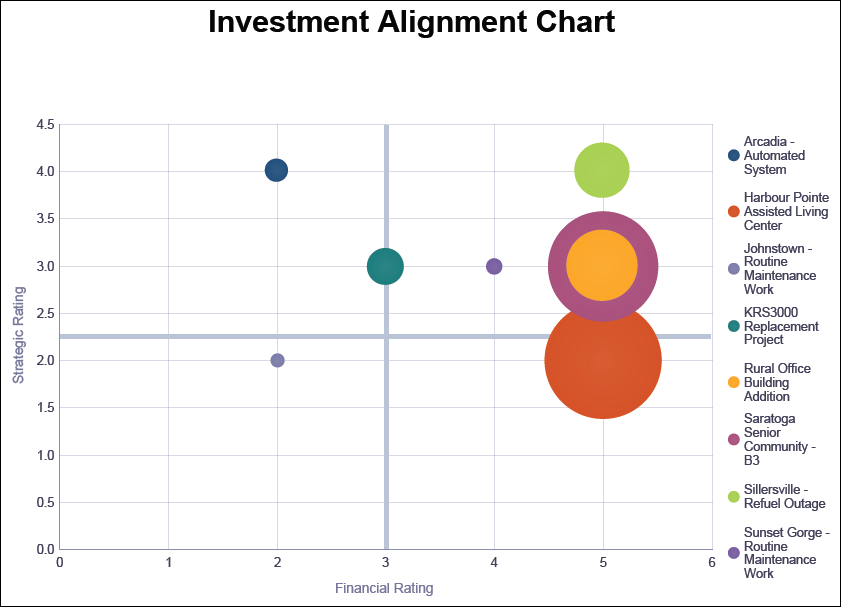
Displays a bubble chart that plots selected projects against their Strategic and Financial Rating with the bubble size representing the At Completion Cost.
Location
- Click Reports.
- On the Report page:
- Click the Reports tab.
- Expand the P6Reports folder.
- Expand the Portfolio folder.
- Click Investment Alignment Chart.