Description
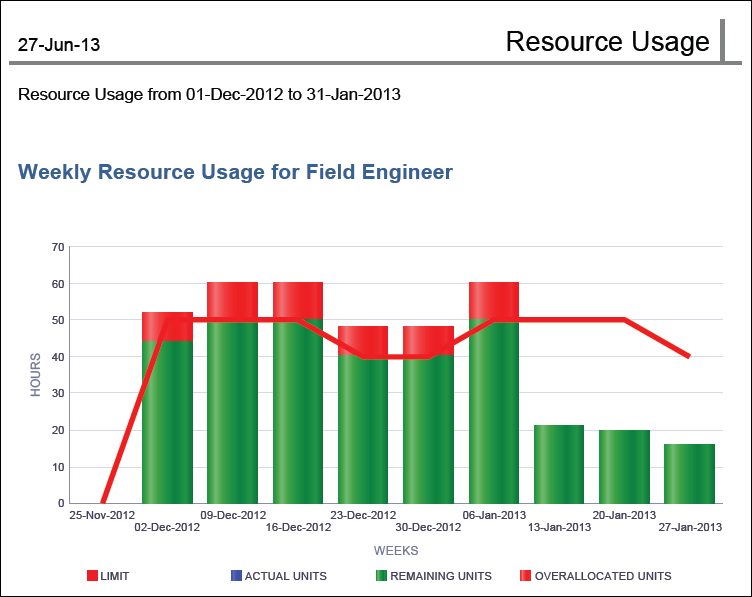
A bar-line graph for each resource showing bars for Actual Units, Remaining Units, and Overallocated Units and a line for the resource's Limit. The y-axis shows hours. The x-axis shows week.
Location
- Click Reports.
- On the Report page:
- Click the Reports tab.
- Expand the P6Reports folder.
- Expand the Resource folder.
- Click Limit Line.