The user interface presents familiar screen elements you manipulate in your web browser. They include all of the following common types of user interface objects and several more special objects not listed:
- pages
- tabs
- dialog boxes
- detail windows
- portlets
- fields
- lists
- buttons
- links
- tables
- charts
- calendars
Refer to the sample images below to orient yourself with the P6 graphical user interface inside your web browser.
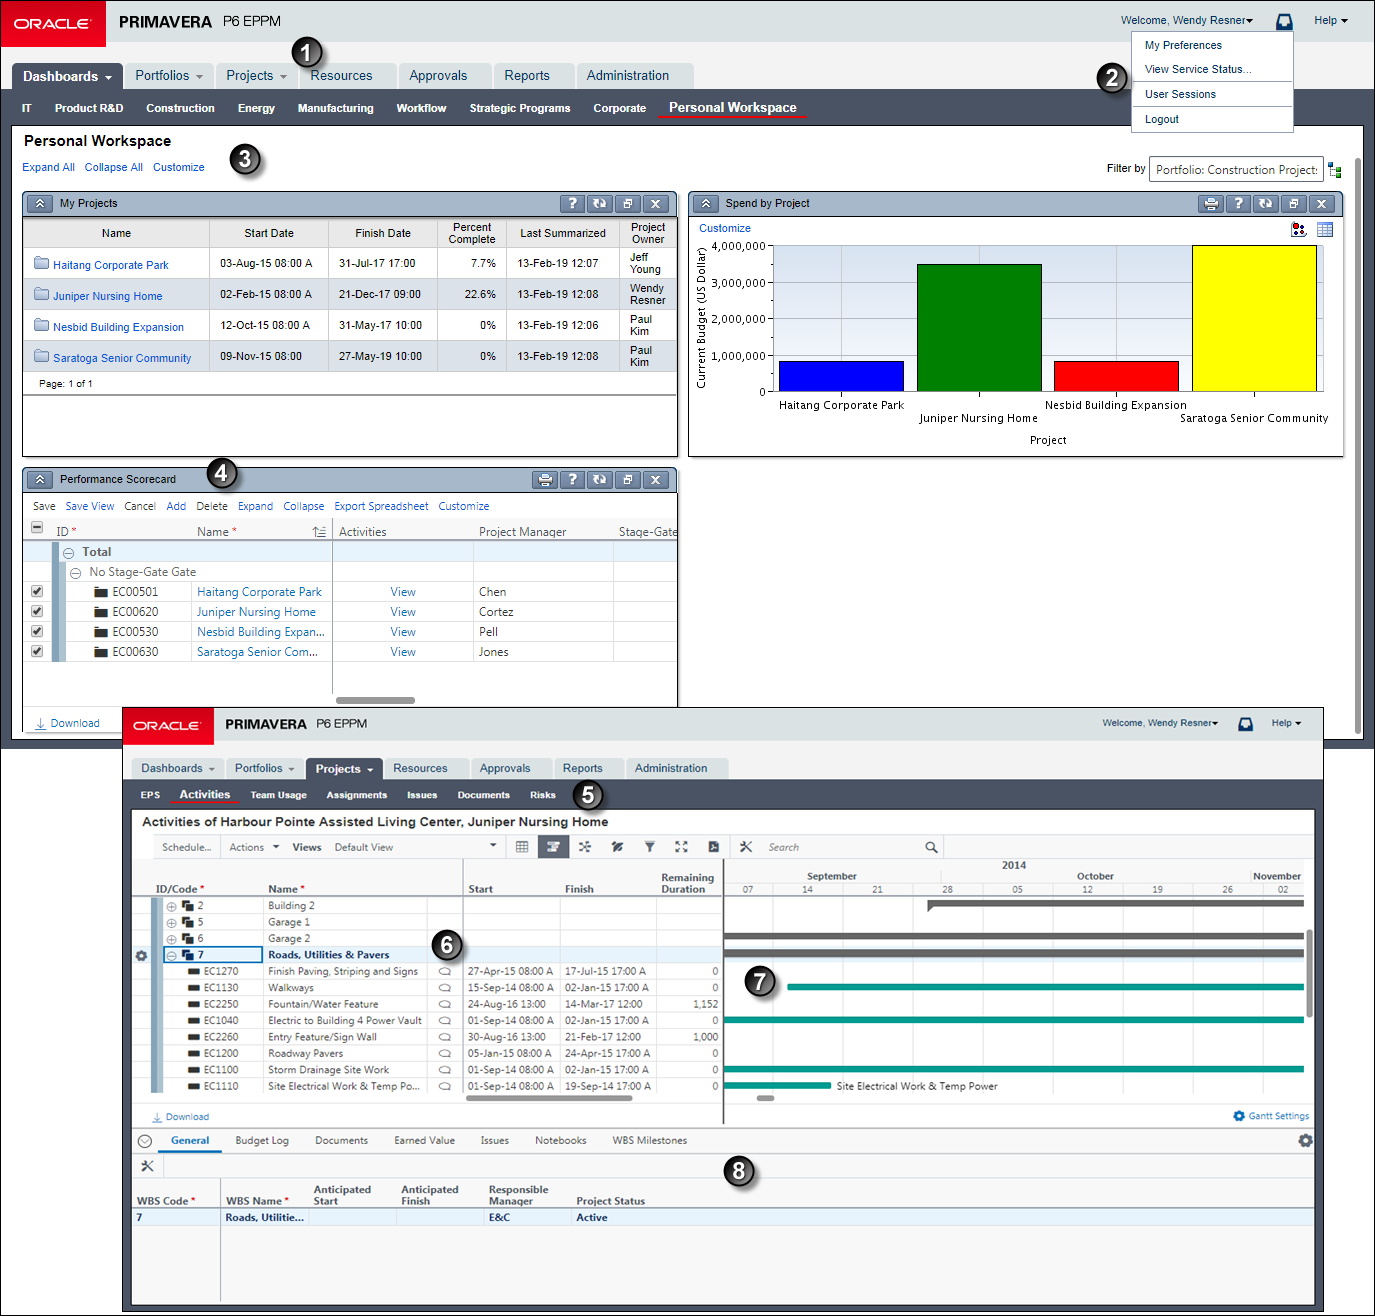
Table of Common User Interface Elements
Item | Description |
|---|---|
| P6 navigation bar: This bar is always visible and shows tabs representing your access to dashboards and any of the main modules of the application. Use it to navigate to the pages and menus in the dashboards, portfolios, projects, resources, or reports sections of the application. |
| User menu: This menu offers access to My Preferences and Logout for all users. Application administrators will also have access to View Service Status.... |
| Personal Workspace dashboard: This default dashboard displays the portlets you have selected that are important to your work goals. In this example, notice the familiar hyperlinks including Customize which you can click to configure the dashboard for use by you or multiple users. Notice too that Personal Workspace is the name for the link you click to open this dashboard, since more than one dashboard may appear on this page. |
| Scorecard portfolio view portlet: In this example, the user has customized this dashboard by adding a portfolio view of type scorecard within its own portlet. The scorecard and can be customized to suit work goals. The colors of a bar chart or histogram are also visible in the Spend by Project portfolio view portlet. |
| Projects navigation bar: This bar shows icons representing pages determined by your assigned user interface view and any custom preferences you made. Similar bars can be found under the Portfolios, Projects, and Resources sections. |
| Activity Table: One of the central work areas of the entire application, this table allows you to customize its columns (fields), grouping bands, and sort options, and of course apply filters. |
| Activity Gantt chart: Shown adjacent to the Activity Table, the Activity Gantt chart represents your schedule. The Gantt chart offers robust customizable project management features including drag and drop editing, timescale, progress lines, relationship lines, spotlights,and helpful mouseover tips |
| General detail window: To gather the related details associated with a particular item in certain tables, the application often provides one or more detail windows in a series along the bottom. On pages supporting applied views, you can determine which detail windows are shown or hidden with your view. |
Note: Your Administrator can provide a URL to the Activities Page directly after logging into the system.