To open a Company level Roll up Cashflow curve worksheet for an existing curve:
- Go to the Company Workspace tab.
- Switch and to User mode.
- From the left Navigator, click Cost Manager node to open. You should see the Cash Flow sub-node. If you cannot see the Cash Flow sub-node, ensure that your company administrator has granted you the necessary permissions to the sub-node.
- Click the Cash Flow sub-node to open the Cash Flow log window.
- Select a Company level Roll up Cashflow curve from the Company level Cash Flow log and double-click the curve to open the Company level Roll up Cashflow curve worksheet window.
The Company level Roll up Cashflow curve worksheet window is divided into two panes. You can open the right-hand pane by way of moving the split screen (slider) to display the cash flow details pane, as shown in the following typical screen capture.
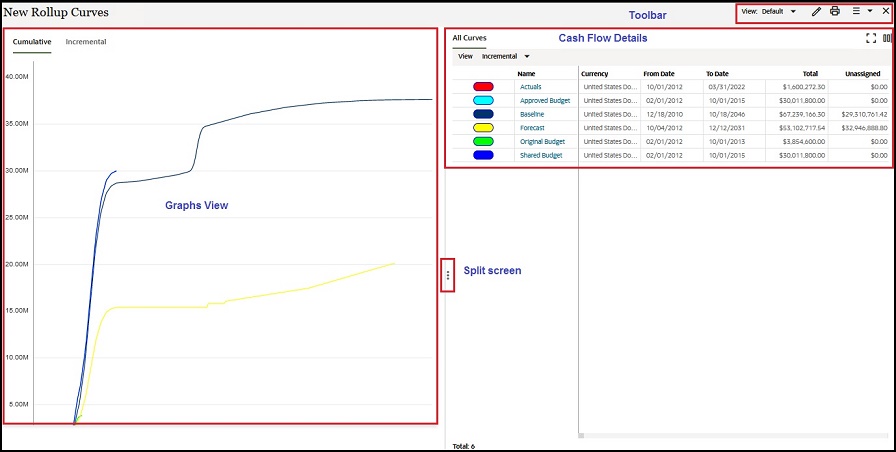
Company Level Roll up Cashflow curve worksheet Window Toolbar
The toolbar options are:
- View drop-down
Use this option to "Create New View" for the worksheet, or to "Manage Views" that have already been created.
Similar to the errors and warnings in BPs, if there are any alerts or errors on the cash flow curve (errors due to mismatch in time scale of project cash flows), then an error icon is displayed the "View" controls that shows the number of errors. When you click on the error icon, a window opens that lists the error messages corresponding to the project cash flow curves.
- Edit View
When you click the Edit View option, the Edit View window opens. In this window you can select the curves that you want to view on the log (for Curves, Inflow, and Outflow). In this window you can also add columns and group your columns when you click the Group By option.
- Print
Select one or more cash flow curves from the log and click Print from the toolbar to access the following print options:
- Print
To open a window that allows you to select a method to print the selected curves.
- Export to CSV
To open a dialog box that allows you to save a Microsoft Excel Comma Separated Values (CSV) File version of the selected curves, so you can export the file to a desired destination.
- Export to Excel
To open a dialog box that allows you to save a Microsoft Excel Worksheet version of the selected curves, so you can export the file to a desired destination.
- Print
- Snapshot menu drop-down
For important details about this option, see Working with Company Level Snapshots.
Company Level Roll up Cashflow curve worksheet Window Graphs View
The graphs view pane provides graphs presentation for the following Roll up Cashflow curves:
- Cumulative curve
A Cumulative curve displays the net of all cash flows over a period of time.
- Incremental curve
An incremental curve displays the cash flow for a certain period.
Company Level Roll up Cashflow curve worksheet Window Cash Flow Details
Note: Use the Expand or Dock icons ![]() (top right corner) to maximize or to adjust the cash flow details pane (All Curves) screen for better visibility.
(top right corner) to maximize or to adjust the cash flow details pane (All Curves) screen for better visibility.
The View option in the cash flow details pane enables you to switch between the Incremental and Cumulative data values. The data sources that have been selected in the properties, are listed within each view selection. If you double-click and open each of the data sources, as described below, then you can see pertinent details for that data source, as described below.
Actuals (Spends)
If you select the Incremental view and click Actuals (Spends) (under the Name column), then the actual spent amounts, per time period, are displayed. These values are not editable and cannot be distributed. You can use the toolbar options to:
- Export
To export one or more curves to a CSV file, which is automatically named after the cash flow worksheet.
- Refresh
To update the data, or amounts, on the page.
- Find on Page
To find a particular amount.
If you select the Cumulative view, then the net of all cash flows, over a period of time is displayed, with the same toolbar options as for the Incremental view.
Approved Budget
If you select the Incremental view and click Approved Budget (under the Name column), then the actual spent amounts, per time period, are displayed. These values are not editable and cannot be distributed. You can use the toolbar options to:
- Export
To export one or more curves to a CSV file, which is automatically named after the cash flow worksheet.
- Refresh
To update the data, or amounts, on the page.
- Find on Page
To find a particular amount.
If you select the Cumulative view, then the net of all cash flows, over a period of time is displayed, with the same toolbar options as for the Incremental view.
Baseline
If you select the Incremental view and click Baseline (under the Name column), then the actual spent amounts, per time period, are displayed. These values are not editable and cannot be distributed. You can use the toolbar options to:
- Export
To export one or more curves to a CSV file, which is automatically named after the cash flow worksheet.
- Refresh
To update the data, or amounts, on the page.
- Find on Page
To find a particular amount.
If you select the Cumulative view, then the net of all cash flows, over a period of time is displayed, with the same toolbar options as for the Incremental view.
Forecast
If you select the Incremental view and click Forecast (under the Name column), then the actual spent amounts, per time period, are displayed. These values are not editable and cannot be distributed. You can use the toolbar options to:
- Export
To export one or more curves to a CSV file, which is automatically named after the cash flow worksheet.
- Refresh
To update the data, or amounts, on the page.
- Find on Page
To find a particular amount.
If you select the Cumulative view, then the net of all cash flows, over a period of time is displayed, with the same toolbar options as for the Incremental view.
Original Budget
If you select the Incremental view and click Original Budget (under the Name column), then the actual spent amounts, per time period, are displayed. These values are not editable and cannot be distributed. You can use the toolbar options to:
- Export
To export one or more curves to a CSV file, which is automatically named after the cash flow worksheet.
- Refresh
To update the data, or amounts, on the page.
- Find on Page
To find a particular amount.
If you select the Cumulative view, then the net of all cash flows, over a period of time is displayed, with the same toolbar options as for the Incremental view.
Shared Budget
If you select the Incremental view and click Shared Budget (under the Name column), then the actual spent amounts, per time period, are displayed. These values are not editable and cannot be distributed. You can use the toolbar options to:
- Export
To export one or more curves to a CSV file, which is automatically named after the cash flow worksheet.
- Refresh
To update the data, or amounts, on the page.
- Find on Page
To find a particular amount.
If you select the Cumulative view, then the net of all cash flows, over a period of time is displayed, with the same toolbar options as for the Incremental view.