Purpose
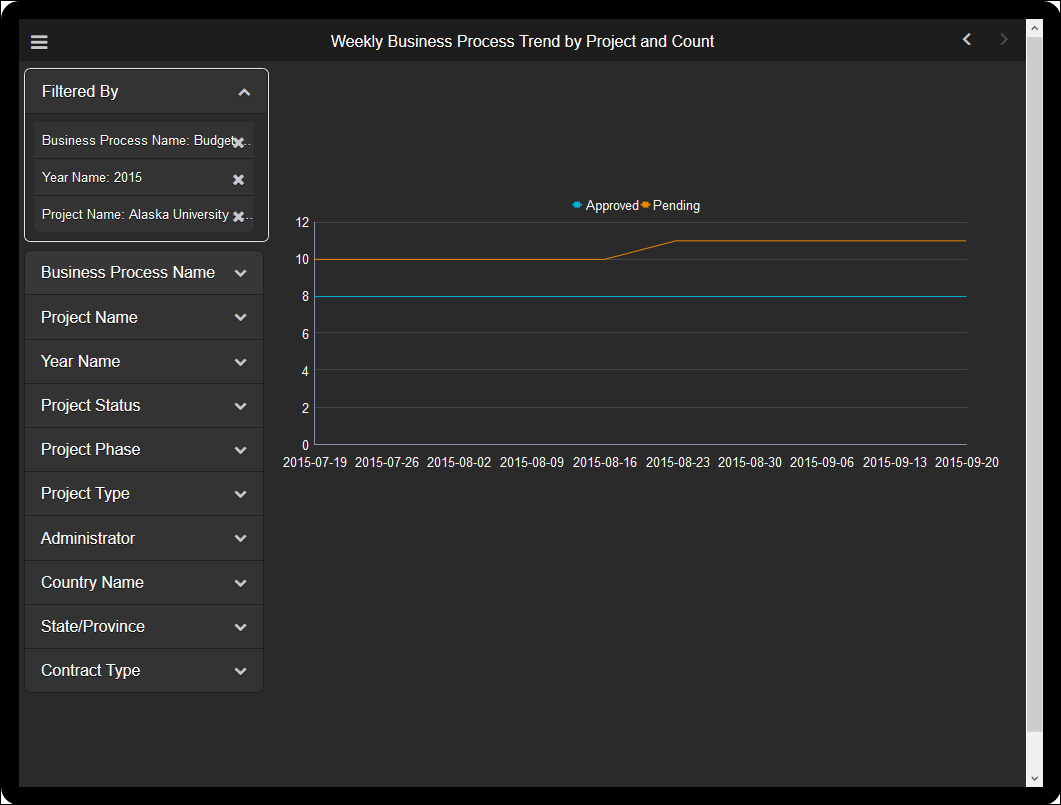
The line chart shows weekly record counts for the selected Business Process and Project. It contains two lines: One for Approved business processes; the other for Pending business processes.
The x-axis shows weeks. The y-axis shows counts.
Subject Area
Business Process History