This chapter provides an understanding of the prerequisites, general and data preparation assumptions and logging into the application.
Topics:
· Accessing the OFSDF Interface or APME Interface
· Organization of the Interface for User Roles
The OFS REG REP APME application allows you to perform the following activities:
· Manage Data Loading and Transformation from various source systems to staging, processing, and results.
· Manage relevant OFSAA metadata for regulatory reporting purposes. This includes creating, modifying, and viewing the metadata used in reporting.
· View the report metadata for mapping.
· Drill down from AgileREPORTER to OFSAA results area.
For prerequisites and detailed instructions on installing this release, see Oracle Financial Services Regulatory Reporting Data Sets and Governance for Asia Pacific and Middle East Jurisdictions (OFS REG REP APME) Installation Guide Release 8.1.1.0.0.
OFSDF interface with Lombard Risk for APME is a reporting application and it does not perform any risk or stress calculations. Following listed are the assumptions for the application:
· Textual and other related portions of reports like personal details, contact details, Yes or No choices must be updated on Report Portal directly and FSDF does not have a placeholder for it.
· Data provided is post reconciliation to ensure that the accuracy of data being reported (non-prescribed by regulators) are performed in OFSAA using various components General Ledger (GL) reconciliation.
· Validity checks such as edit checks, cross-validation checks and so on prescribed by the regulator are performed within the AgileREPORTER.
· All monetary amounts are expected to be positive in number, except valuation outputs which can be positive or negative. There are few exceptions like Excess payments scenarios in Loans/cards where Balance loaded can be in Negative Signage. Rules are constructed assuming the negative sign of valuation amounts wherever applicable.
· The application populates a few specific dimension tables, known as seeded / sample tables as part of the installation script. Since they are used in the metadata, changes in data values have an impact on overall functioning.
· All percentage data are expected in decimal format meaning 9% must be provided as 9 and not 0.09.
· For data provided as of date, such as the last day of the quarter of the reporting year: Quarterly and Year to Date (YTD) report for the given date display the same value for those measures which are of as of the date in nature. For example, the Annual and Quarterly Balance Sheet and BASEL report generated as of 31-MAR show the same values for all measures such as Account Balance.
Generic assumptions related to the Scoped Reports (APRA) are as follows:
· Domestic Books Consolidation: EFS reports are reported based on domestic book consolidation. RRS product expects this to be handled at the data set level, so the data set with appropriate entity filters gets associated with the reports for required entities reporting.
· Account-level data for consolidated entities: At a dataset level, the customer expected to provide account-level data for only those entities that are consolidated for Reg Reporting. For such entities, Dim_Org_Structure.f_regulatory_entity_ind should be Y, although dim_org_structure will hold details of all entities related to reporting entity falling under the same org structure.
· Intra Group Party Vs Related Party: For EFS reports, Intra Group Party and Related Party are considered the same, as EFS includes reporting of only domestic book accounts and these two terms are used interchangeably in the reporting instructions.
· Balance Sheet Category: All products available in table dim_product.v_balance_sheet_category must be classified as one of the following categories. The reason behind this is that many reports use Asset or Liability as Hierarchy to report overall Assets or Liabilities.
v_balance_sheet_category |
v_balance_sheet_category_desc |
|---|---|
ASSET |
Asset |
LIABILITY |
Liability |
OFFBSL |
Off-Balance Sheet (Contingent) Liability |
OFFBSA |
Off-Balance Sheet (Contingent) Asset |
DERV |
Derivatives |
· Housing loan Vs Mortgage Loan: Housing loan is captured via Product Category as Housing Loan (Dim_Reg_Product_Type. v_reg_prod_cat_cd=HOUSELN), which is different from Mortgage Loan (Dim_Reg_Product_Type. v_reg_prod_cat_cd=MORLN) based on APRA definitions. All Mortgage Loans will not be Housing Loans.
· Foreign Currency Conversion: AUD is the reporting currency used across all reports. All exposures in Foreign currency are converted to AUD based on Spot rate on as of date when data is provided.
· Data for states: Table DIM_LOCATION is used for capturing various states within Australia. This table is populated via SCD STG_LOCATION_MASTER. Expected values are as follows:
V_COUNTRY_CODE |
V_COUNTRY_DESC |
V_STATE_ CODE |
V_STATE_DESC |
V_ISO_STATE_CODE |
V_ISO_STATE_DESC |
|---|---|---|---|---|---|
AU |
AUSTRALIA |
AU-NSW |
New South Wales |
AU-NSW |
New South Wales |
AU |
AUSTRALIA |
AU-VIC |
Victoria |
AU-VIC |
Victoria |
AU |
AUSTRALIA |
AU-QLD |
Queensland |
AU-QLD |
Queensland |
AU |
AUSTRALIA |
AU-SA |
South Australia |
AU-SA |
South Australia |
AU |
AUSTRALIA |
AU-WA |
Western Australia |
AU-WA |
Western Australia |
AU |
AUSTRALIA |
AU-TAS |
Tasmania |
AU-TAS |
Tasmania |
AU |
AUSTRALIA |
AU-NT |
Northern Territory |
AU-NT |
Northern Territory |
AU |
AUSTRALIA |
AU-ACT |
Australian Capital Territory |
AU-ACT |
Australian Capital Territory |
AU |
AUSTRALIA |
AU-OTHTER |
Other Australian territories and overseas |
AU-OTHTER |
Other Australian territories and overseas |
AU |
AUSTRALIA |
AU-NSW |
New South Wales |
AU-NSW |
New South Wales |
AU |
AUSTRALIA |
AU-VIC |
Victoria |
AU-VIC |
Victoria |
AU |
AUSTRALIA |
AU-QLD |
Queensland |
AU-QLD |
Queensland |
AU |
AUSTRALIA |
AU-SA |
South Australia |
AU-SA |
South Australia |
AU |
AUSTRALIA |
AU-WA |
Western Australia |
AU-WA |
Western Australia |
AU |
AUSTRALIA |
AU-TAS |
Tasmania |
AU-TAS |
Tasmania |
AU |
AUSTRALIA |
AU-NT |
Northern Territory |
AU-NT |
Northern Territory |
AU |
AUSTRALIA |
AU-ACT |
Australian Capital Territory |
AU-ACT |
Australian Capital Territory |
AU |
AUSTRALIA |
AU-OTHTER |
Other Australian territories and overseas |
AU-OTHTER |
Other Australian territories and overseas |
· Customer Location: When the Location of the customer is required, data is expected in the product processor tables and DIM_CUSTOMER.V_CUST_LOCATION_CODE.
· Bills of exchange or bills accepted: Bills has very complex reporting requirements in EFS Phase 1 reports. Our interpretation of reporting is based on individual instruction sheets(ARS), reporting practice guide (RPG 701.0) and definition sheet (ARS 701.0)
· Exclusion of certain accounts: Instruction sheet of some reports explicitly dont mention the exclusion of some types of accounts like
§ Written off accounts and
§ Accounts with an outstanding balance as 0
§ Accounts with related parties
However, when we read the instructions for reconciliations across reports, we conclude that these filters need to be applied, to match the values across and within reports. Eg: Report ARF 742_0A/B, 744_0A/B (along with other reports) uses both these filters for written off and nil outstanding. ARF 746_0A/B excludes all these three. Hence, these filters have been applied according to the reconciliation sheet.
· Day Count: Day Count of 30 days a month and 365 days a year has been used across the reports. This is based on instructions sheets of various reports.
· Mitigant amount adjusted for a haircut:
STG_ACCOUNT_MITIGANT_MAP/FCT_ACCOUNT_MITIGANT_MAP.n_mitigant_weight
This column stores the effective % of exposure amount covered by mitigant. This % is after adjustment of haircut that should be applied to mitigant or exposure amount and data is expected accordingly post-optimization of mitigants.
Report specific assumptions related to the Scoped Reports (APRA) are as follows:
· Report ARF 720_0A/B Line 12: Total intra-group assets
The number reported in Report ARF 720_0A/B Line 12: Total intra-group assets should match with report ARF 720_3 Line 1.1: Total intra-group assets.
· As per interpretation, these instructions are contradicting. Per instructions of ARF 720_3, Provisions must be excluded, but there is no such requirement of excluding Provision in ARF 720_0A/B.
· Report ARF 720_0B Line 3.14: Other debt securities - short term
Lines 3.3 to 3.13 report exposures to various Party Types that are Residents. Line 3.14 reports two kinds of exposures:
§ Exposures to all party types that are Non-residents, for party types reported in lines 3.3 to 3.13
§ Exposures to all resident party types other than party types reported in lines 3.3 to 3.13
· Report ARF 720_5/6 - Stock Exchange Code:
Equity Securities that are traded on ASX are expected to have value in DIM_INSTRUMENT_CONTRACT.V_MARKET_EXCHANGE_NAME = ASX
· Report ARF 742_0A/B: Loan accounts due to Internal refinance will have a new account open date, so they will be treated as new accounts.
· Report ARF 742_0A/B, 743:
§ In case the bank has refinanced loans in the balance sheet (both external or internal refinance), Stg_Loan_Contracts.f_refinance_flag flag should be Y).
§ Accumulated Excess repayment amount is expected as inclusive of redraw facility amount and offset account balance.
· Report ARF 742_0A/B: Loan accounts due to Internal refinance should have a new account open date, so they will be treated as new accounts.
· Reporting of averages number of facilities & sanctioned limit in Reports ARF743, ARF742_0A & ARF742_0B:
§ Reporting of averages number of facilities and sanctioned limit would more aptly reflect the actual average if we exclude accounts that have zero values for these measures. This is different from calculation of simple average mathematically where 0 values are not excluded. Though instructions sheet doesn't specifically mention about excluding such accounts from average calculation, we are excluding these to give these reporting numbers the correct functional definition. This enhancement is not part of current release. It will be accommodated in the future release. It will affect the few average reporting cells from reports ARF743, ARF742_0A & ARF742_0B.
· Reporting by loan purpose (ARF 741, ARF 743, ARF 745):
§ Loan purpose is expected as an input by bank based on Reporting Guide RPG 701.0. This should take into account all instructions mentioned in RPG 701.10, including, but not limited to below:
— Any loan with multiple purposes needs to be reported against the predominant purpose
— If refinanced loan has a new loan purpose, additional refinanced portion needs to be reported under new loan purpose. But if refinanced loan as existing same loan purpose as before, it needs to be reported as Internally refinanced or externally refinanced loan as per RPG 701.0.
Known issues related to the Scoped Reports (APRA) are as follows:
· Commercial property lending: For identification of Commercial property lending, currently, we are using V_REG_LOAN_PURPOSE_CODE = CRE. This needs to be removed. The new design will require bringing in new column f_cre_lending_flag in stg_loan_contracts and FCAS to identify Commercial property lending as per the Definition sheet. It is impacting 3 cells in report 720_1A/B, 3 cells impacted are: BSAO27773,BSAO27774,BSAO27775.
· Net of Offset Account balance: Some reports require loan accounts balance to be reported as net of offset or setoff account balance that these loans are linked with. Our design covers the use case of full offset which is valid for most of the accounts (100% of the offset account balance is netted off against loan account balance). Where offset percent is less than 100%, the current design doesn't handle this use case in 8.0.8 release. This will be handled in the next release. The following report are impacted- 742, 743, 744
· Canceled Accounts: Issue # 5. Canceled Indicator - We have to report for Cancellations of and reductions in previously committed (and accepted) credit limits during the month. The current design takes a sanctioned limit from the previous month and subtracts the current month limit. This assumes that for any account canceled, the sanctioned limit will be put as 0, and data is expected accordingly for the report to have correct reporting numbers. In the next release, we will make changes, so we can report cancellations, even though sanctioned limit in data is not 0. This impact reports 741,743,745, 2 cells each report.
Assumptions related to the Scoped Reports (MAS)
The assumptions related to the Scoped Reports (MAS) are as follows:
For the purposes of MAS610 reports, Intra Group Party and Related Party are considered same.
All products available in table dim_product.v_balance_sheet_category must be classified as one of the following categories. Reason behind this is that many reports use Asset/Liability as Hierarchy to report overall Assets/Liabilities.
Convention |
Meaning |
|---|---|
ASSET |
Asset |
LIABILITY |
Liability |
OFFBSL |
Off Balance Sheet (Contingent) Liability |
OFFBSA |
Off Balance Sheet (Contingent) Asset |
DERV |
Derivatives |
Foreign Currency Conversion: SGD is the reporting currency used across all reports. All exposures in foreign currency are converted to SGD based on Spot rate on as of date when data is provided except Schedule I. USD is the reporting currency for Schedule I which includes I_Part I & I_part II. All exposures related to I schedule in foreign currency are converted to SGD first & than all exposures will be converted to USD from SGD based on Spot rate on as of date when data is provided.
All Assets product balances are reported at end of period balances in B1 & B2 schedules from which stage loss allowances and impairment loss allowances are deducted to match the balances across schedules of MAS610 reports.
There is a line item in B1 report as Assets held for sale mentioned separately, to satisfy this condition and to avoid repeated reporting all other assets items of this report are reported as Not held for sale. Same assumption is being followed for other assets related schedules to match the figures across schedules of MAS610.
As stated above there is a line item in B2 report as Liabilities of disposal groups held for sale mentioned separately, to satisfy this condition and to avoid repeated reporting all other liabilities items of this report are reported as Not held for sale. Same assumption is being followed for other liabilities related schedules to match the figures across schedules of MAS610.
B1_2 report Part II has a section on AMOUNTS RECEIVABLE UNDER REVERSE REPURCHASE AGREEMENTS wherein the balances have to be reported for different underlying securities of reverse repurchase agreements. Mapping for Loans and advances as one of the underlying securities is not being done due to insufficient instruction of loans being considered as one of the underlying of reverse repurchase agreement.
Held for Sale filter is being given across B1 & B2 schedules to make data consistent across reports.
There is a line item in B3_22 report as unrated eligible liquidity facilities. Mapping is not given for the unrated portion of this cell as the requirement is not clear and lack of instructions.
Held for Sale filter is being given across C & D set of schedules to make data consistent with B1 & B2 schedules.
Only balances being considered in Cash & Balances section in C schedule due to insufficient instructions.
Fiduciary flag exclusion is being given across all reports to exclude fiduciary related exposures for MAS610.
Only balances being considered in Cash & Balances section in D1 & D2 schedule across all counterparties, Cash is being taken against other counterparty only. Also prominent country data is being considered for cases where one currency is qualifying for multiple countries. There is one processing table named as FSI_JUR_COUNTRY_CURR_MAP wherein currencies are mapped against prominent countries against which Cash is being reported in respective currencies in D1 & D2 schedules.
Credit Facility amount in D3 section is being based on revocable status of the facility. If the facility is revocable than measure is considered as outstanding balance and if the facility is irrevocable which is also a default case, measure is considered as outstanding plus undrawn balance.
There is a line item in E1 report as Assets held for sale mentioned separately, to satisfy this condition and to avoid repeated reporting all other assets items of this report are reported as Not held for sale. Same assumption is being followed for other assets related schedules to match the figures across schedules of MAS610.
As stated above there is a line item in E1 report as Liabilities of disposal groups held for sale mentioned separately, to satisfy this condition and to avoid repeated reporting all other liabilities items of this report are reported as Not held for sale. Same assumption is being followed for other liabilities related schedules to match the figures across schedules of MAS610.
Data is not provided for few Cell IDs in E1 due to insufficient instructions around it. These cell IDs are E1R1C1, E1R2C1, E1R2C4, E1R3C1, E1R19C1, E1R19C4, E1R21C1, E1R21C4, E1R27C1, E1R27C4, E1R28C1, E1R29C1, E1R29C4, E1R30C4, E1R31C4, E1R33C1 and E1R33C4.
Held for Sale filter is being given across E schedules to make data consistent across reports.
Islamic banking is being considered as one of the line of business category & accordingly mapping is provided across cells for E_2 schedule in line with B1 & B2 Schedules.
Corporate Counterparty in F1 is inclusive of Financial & Non-Financial Corporates so it also includes Non-Bank Financial Institutions counterparty.
Only balances being considered in Cash & Balances section in E_1 schedule due to insufficient instructions.
Fiduciary flag exclusion is being given across all reports to exclude fiduciary related exposures for MAS610.
Mapping for International organizations in F_3 is not being provides as instructions are not clear, as specific counterparty data is being asked in each column of this schedule as Corporate & Unincorporated which is clashing with International organizations counterparty.
Only balances being considered in Cash & Balances section in G schedule due to insufficient instructions.
Mappings are not provided for General ledger items in G Schedule as this schedule is based on interest rate repricing & instructions are not clear for general ledger line items.
Held for Sale filter is being given across G & H schedules to make data consistent across reports.
Mappings for part I in J schedule are not provided as it is assumed as descriptive fields.
Mappings for part III, IV, V & VIII in J schedule are not provided due to insufficient instructions.
Mappings for part I in L_2 schedule are not provided due to insufficient instructions.
Mappings for part II & III in M schedule are not provided as it is assumed as descriptive fields.
After the application is installed and configured, to access the OFSDF Interface with Lombard Risk for OFS REG REP APME application, you must log in to the OFSAAI environment using the OFSAAI login page.
To access the application, follow these steps:
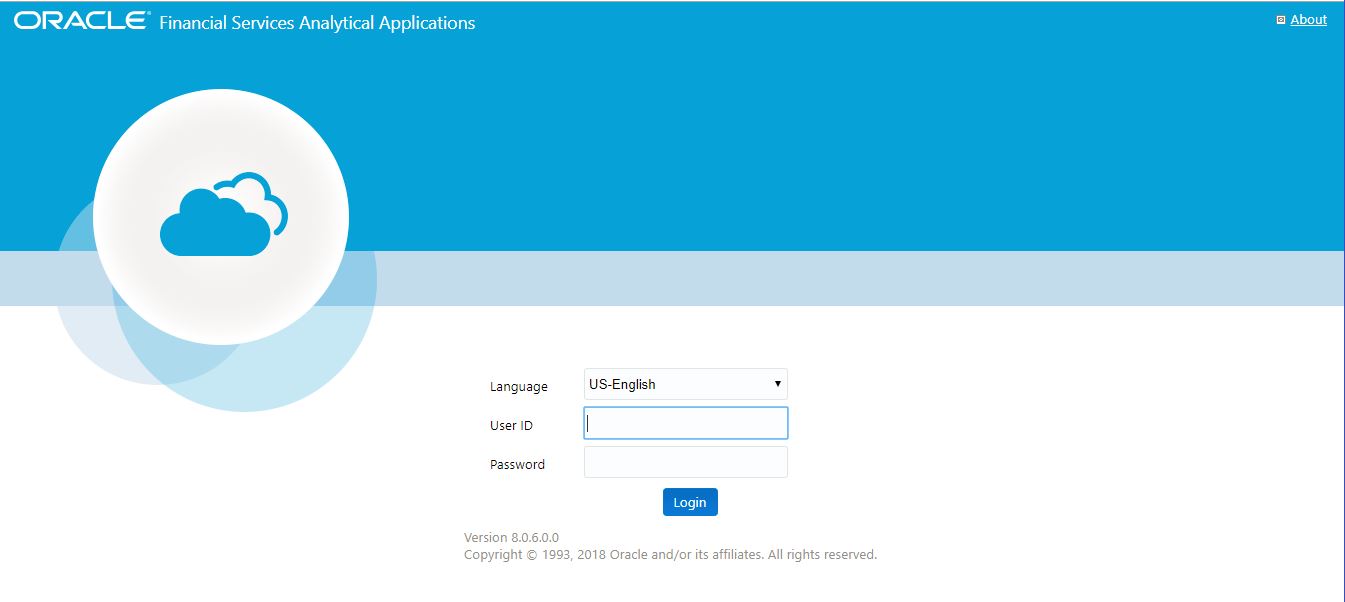
1. Enter the OFSAAI URL in your browser. The OFSAAI login page is displayed.
Figure 2: OFSAAI Log In

2. Select the desired language from the Language drop-down list.
3. Enter your User ID and Password. When you log into OFSAAI, the OFSAAI Applications page is displayed. Select Financial Services Data Foundation.
Figure 3: OFSAAI Application Page

4. Select the Financial Services Data Foundation option to navigate to the FSDF application or select the Oracle Financial Services Regulatory Reporting Data Sets and Governance for Asia Pacific and Middle East Jurisdictions to navigate to the OFS REG REP APME application.
This section explains the various features used by an analyst. It describes the organization of the user interface and provides step-by-step instructions for navigating through the application to carry out these activities.
To access the Process Execution Summary, the following roles must be assigned to the user:
1. Modify Run Parameters
2. Approve Reporting Flag
3. Override Reporting Flag
4. Request Reporting Flag
5. Run Reporting Flag
6. View Run Details
Data Analysts are expected to perform the following activities:
1. Executing Batch to Refresh Derived Entities
2. Drill down from AgileREPORTER to OFSDF
Regulatory Report Analysts are expected to perform the following activities:
1. Drill down from AgileREPORTER to OFSDF
2. Using Metadata Browser to check schedule wise metadata
3. Using Metadata Browser to check metadata usage across schedules
Topics:
· Reporting Flag for Run through Process Execution Summary
· Executing Batch to Resave Derived Entities
· Retrieving the Returns from AgileREPORTER
· Report Verification - Drill Down from AgileREPORTER to OFSAA Results Area
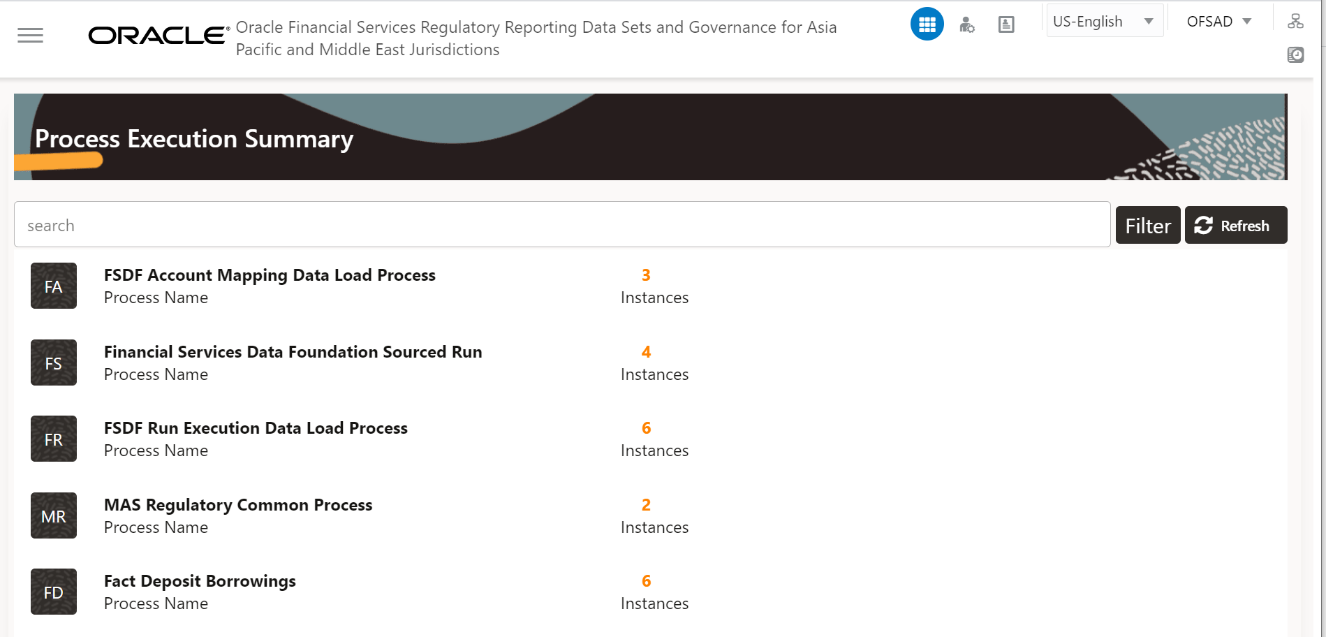
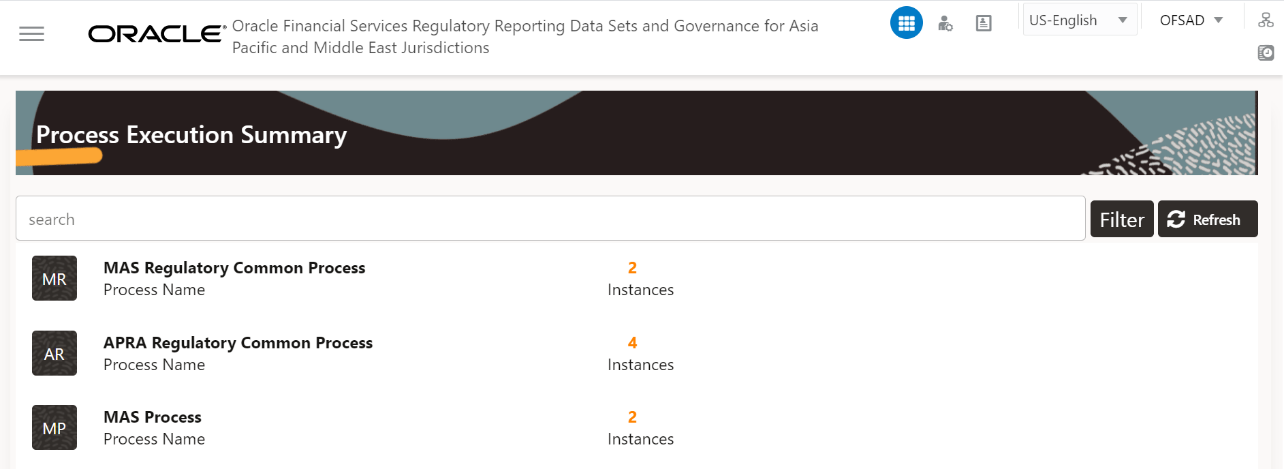
This section provides information on the Runs that are applicable for APME. The Process Execution Summary is launched once the Runs are executed from the Processing Modelling Framework. The following figure displays the Process Execution Summary with the data that is retrieved from the Process Modeler.
Various applications provide the data for regulatory reporting. You must mark specific executions for regulatory reporting as the final run.
1. After logging into OFSAAI applications page, navigate to Oracle Financial Services Regulatory Reporting Data Sets and Governance for Asia Pacific and Middle East Jurisdictions and select Process Execution Summary.
Figure 4: Process Execution Summary Screen
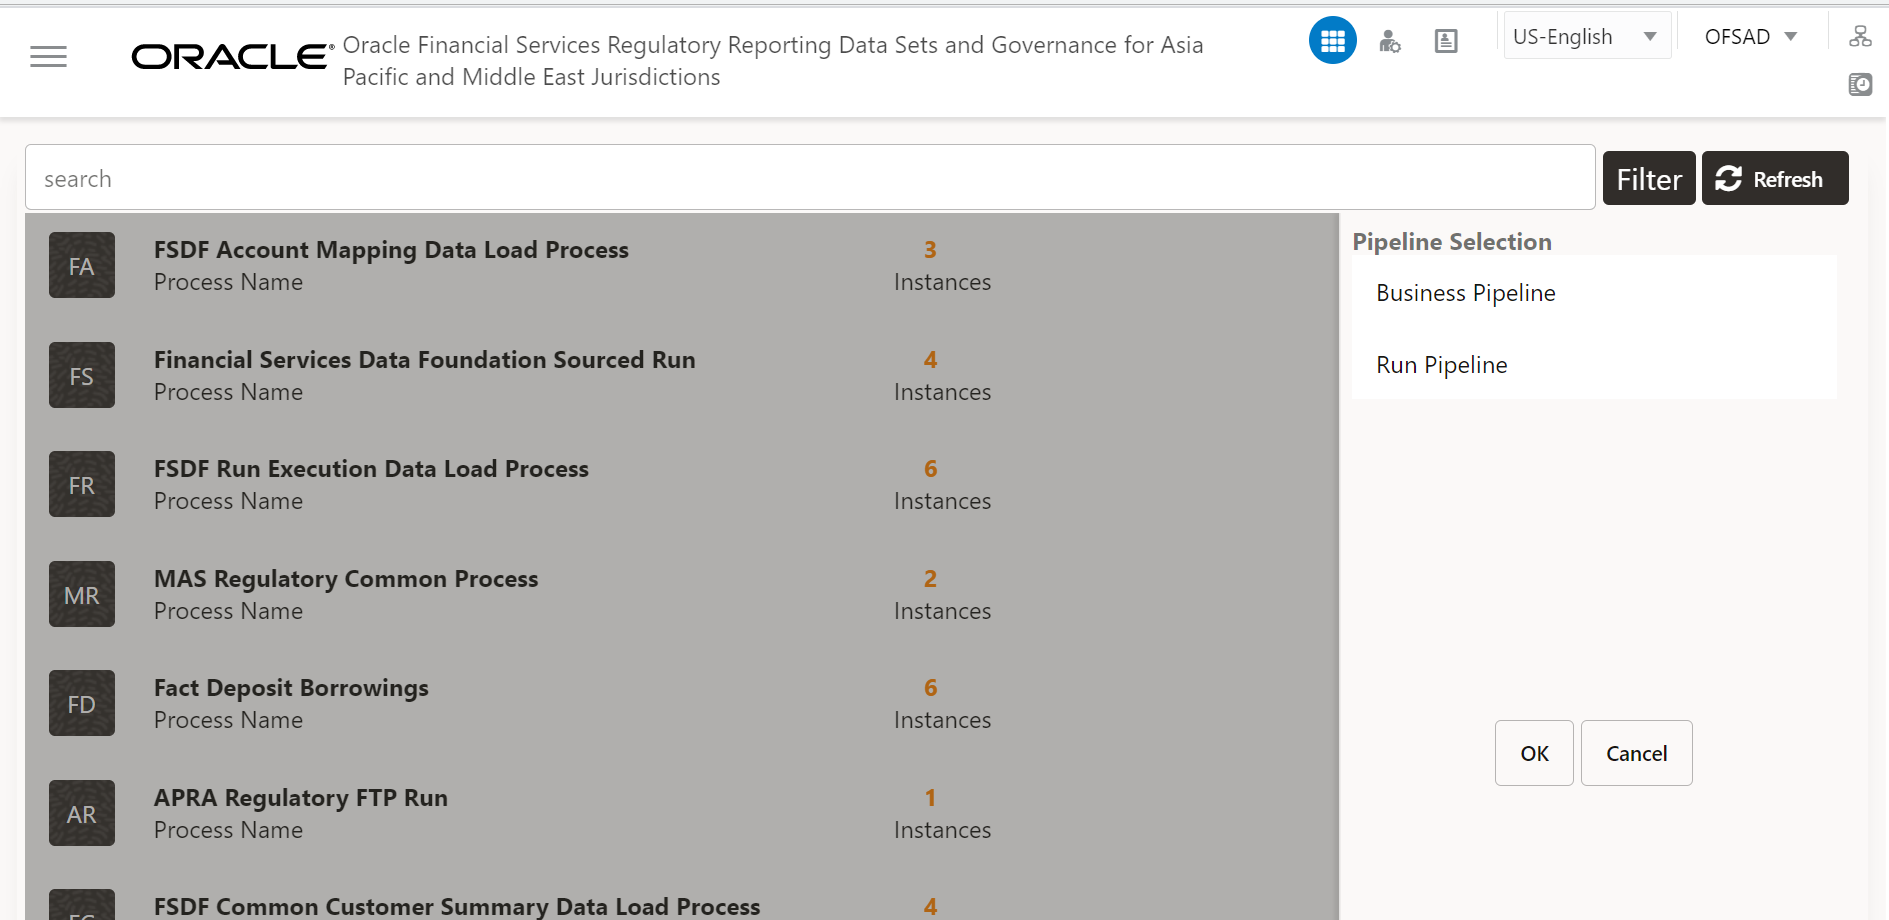
2. Scroll towards the right and click Filter, select the Run Pipeline from the available pipeline selection list. Click OK.
Figure 5: Pipeline Selection Screen
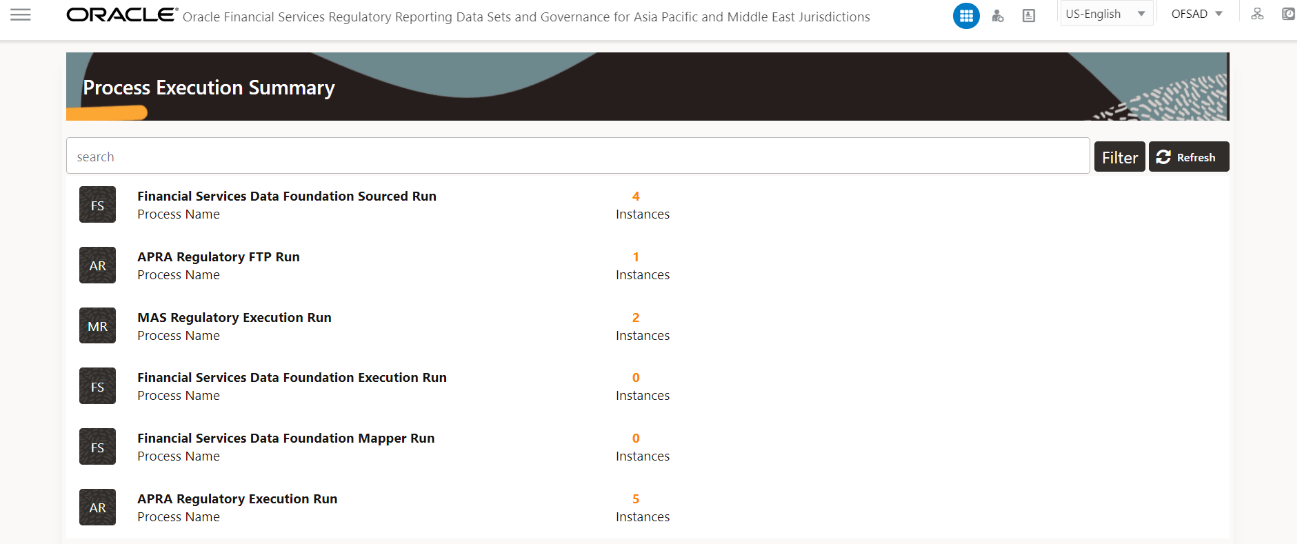
3. After the Run execution, the Process Execution Summary is generated in the list format as illustrated in the following steps. The summary page displays the Process Names for which the Run Parameters are generated.
4. Scroll towards
the right and click View  in the Process Name
row.
Figure 6: Process Execution Summary View Screen
You can view the detailed definition of a Run on a read-only mode. The Process Execution Details page displays the execution details for the selected Execution Key with the color band displaying the status of each Execution Key.
Figure 7: Process Execution Details Screen
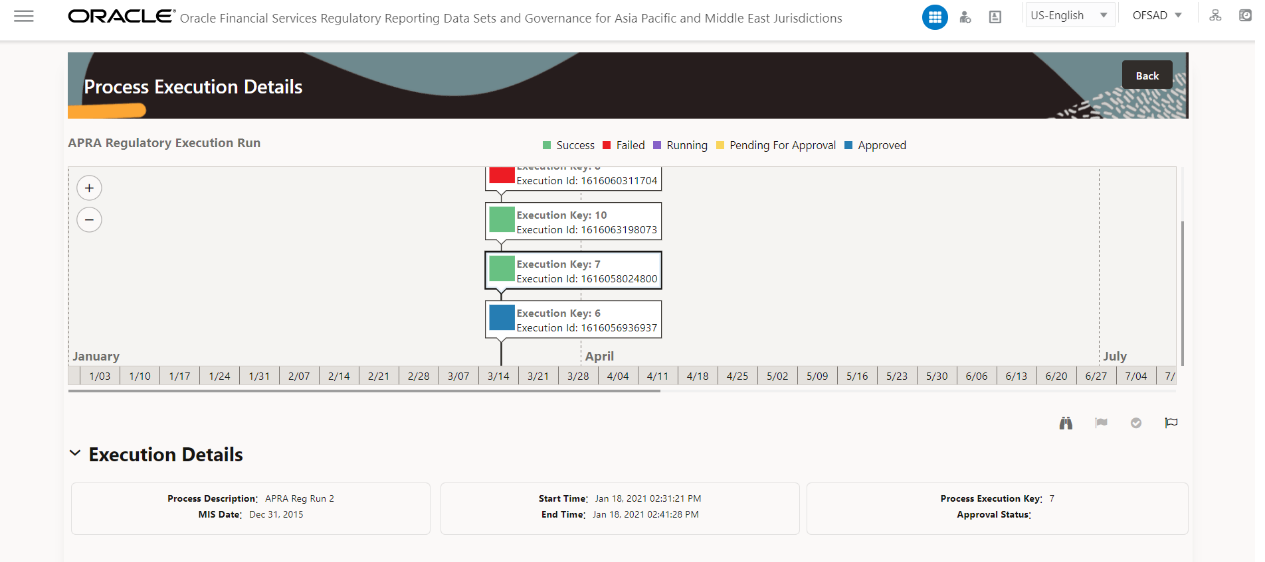
The execution keys and the corresponding execution details are as follows:
· Process Description: The MAS or APRA Regulatory Common Process Run appears as the process description when the user executes the Regulatory Run.
· MIS Date: The extraction date is displayed in this field.
· Start Time: It displays the Execution Date and the Execution Time when the Execution Run starts.
· End Time: It displays the End Execution Date and Execution Time.
· Process Execution Key: Unique identifier assigned to each Process Execution.
· Approval Status: It displays the Approval status of the Execution as Completed, Failed, or Ongoing.
· Process Monitor: This helps to show the run definition as defined in the process modeling framework. There are four icons in the Process Monitor as follows:
§ PMF
Launch: Click View  to
view the Process flow associated with the selected run.
§ Request
Report Flag: To request for a Reporting Run, select an Execution
ID in the Process Execution Summary page and click the Request Report
Flag  .
A dialog box will appear for you to input your comments. Click Submit
and the status of this Run is displayed in the Reporting Flag section.
Only a successful execution can be requested for reporting. For the selected
Run and Execution date, there can be only one reporting flag.
§ Approve
Reprt Flag: After submitting the Reporting Run in the earlier section,
the Approve Report Flag  is
enabled. When you click the Approve Report Flag, a dialog box is displayed
with User oComments and Approver Comments. The Approver can update the
comments in the Approver Comments field and then click Approve or Reject.
§ Override
Report Flag: Any reporting execution can be overwritten with another
execution. Select a successfully triggered batch in the Process Execution
Summary page. The Override Report Flag  is enabled if an execution is already marked
as a Reporting Flag. You can override the execution by updating your comments.
This must be approved by the approver and the procedure is similar to
the procedure detailed in the Approve Report Flag for a Run section.
To request, approve, and override a flag for the process execution, perform the following steps:
1. Navigate to Oracle Financial Services Regulatory Reporting Data Sets and Governance for Asia Pacific and Middle East Jurisdictions and select Process Execution Summary.
Figure 8: Process Execution Summary Page

2. Scroll towards the right and click Filter, select the Run Pipeline from the available pipeline selection list. Click OK.
Figure 9: Process Execution Summary Filter Search Result Pane
3. Scroll towards
the right and click View  in the Process Name
row.
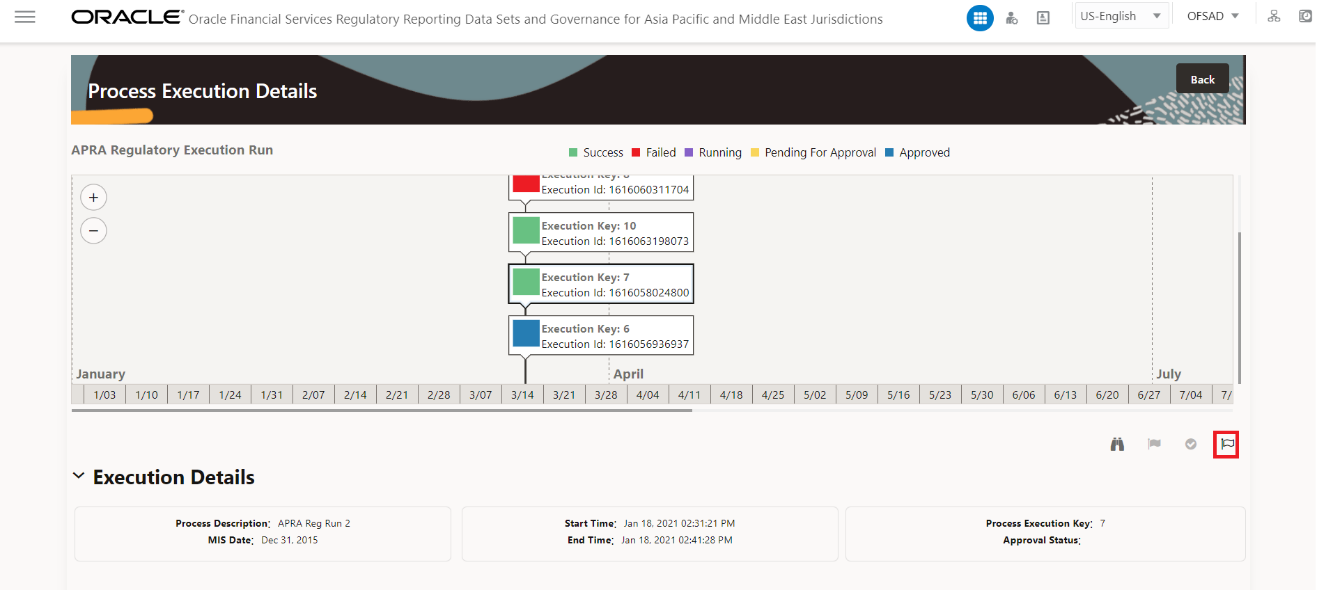
Figure 10: Process Execution Details Page

4. Select Request
Report Flag  to
request a report flag for the selected run execution.
Figure 11: Request Report Flag Window
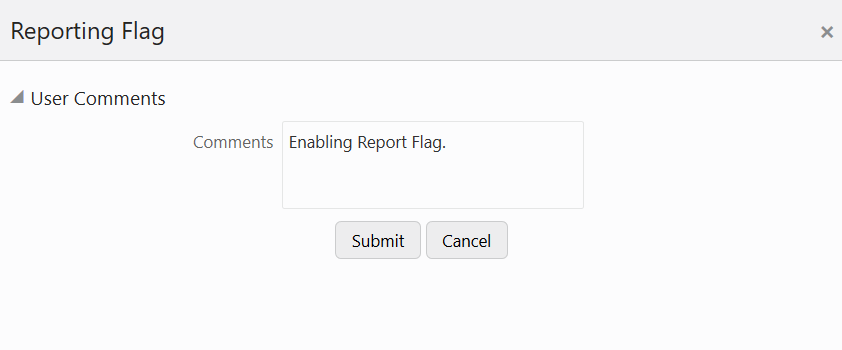
5. Enter information in the Comments field and click Submit. The request report flag for a run is saved successfully.
To approve the report flag, perform the following steps:
1. Navigate to the Process Execution Summary page and select the process name for which the report flag must be approved.
2. Click Approve
 to
approve the request.
3. Enter the information in the Approve Request Flag page.
4. Click Approve to approve the requested report flag.
To override the report flag for a successful run, perform the following steps:
1. Navigate to the Process Execution Summary page and select the process name for which the report flag must be overridden.
2. Click Override
Report Flag  to
override the report flag.
Figure 12: Override Request Report Flag
3. Enter the information in the Override Report Flag window.
Figure 13: Override Report Flag Details Window
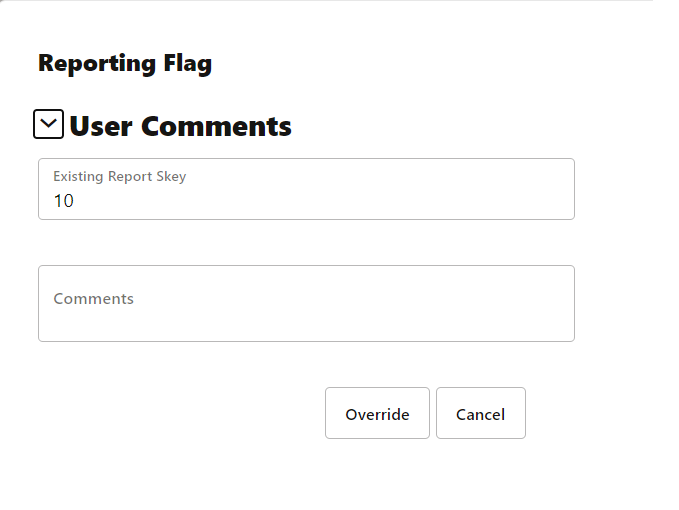
4. Click Override to override the requested report flag.
Figure 14: Report Flag Pending for Approval page
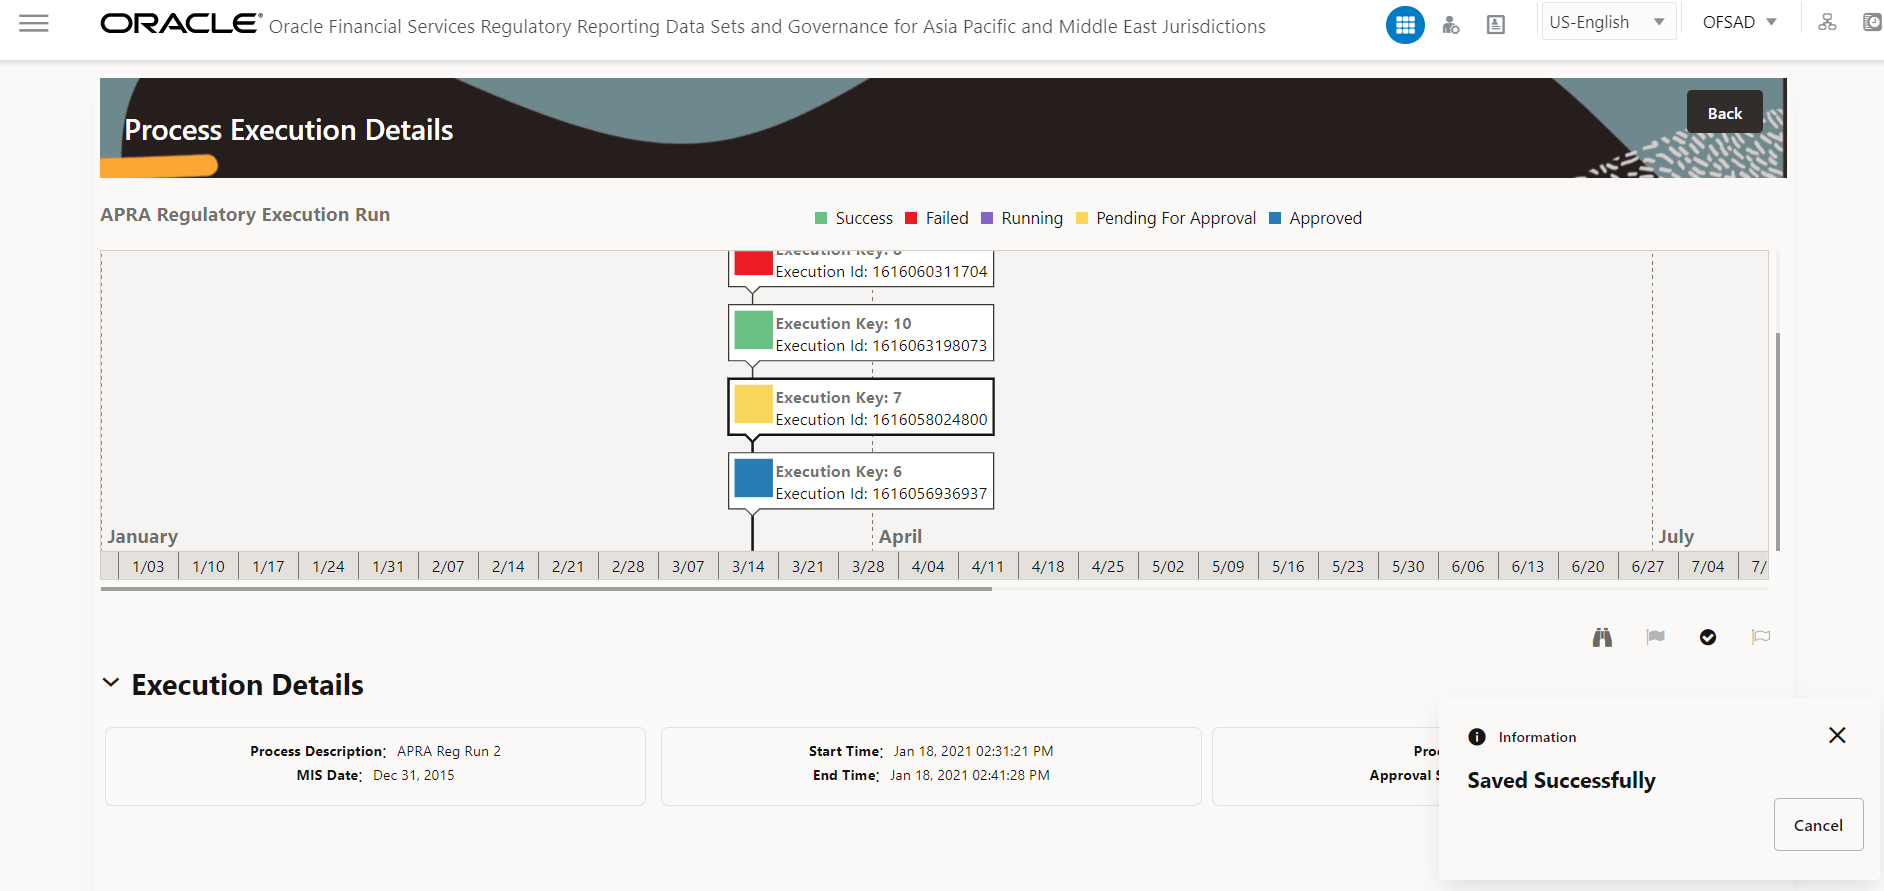
5. Click Approve
Report Flag  to
approve the override report flag request.
Figure 15: Approve Override Report Flag Window

6. Enter the information in the Approver Comments field and click Approve and the report flag is overridden successfully.
Figure 16: Overridden Report Flag page
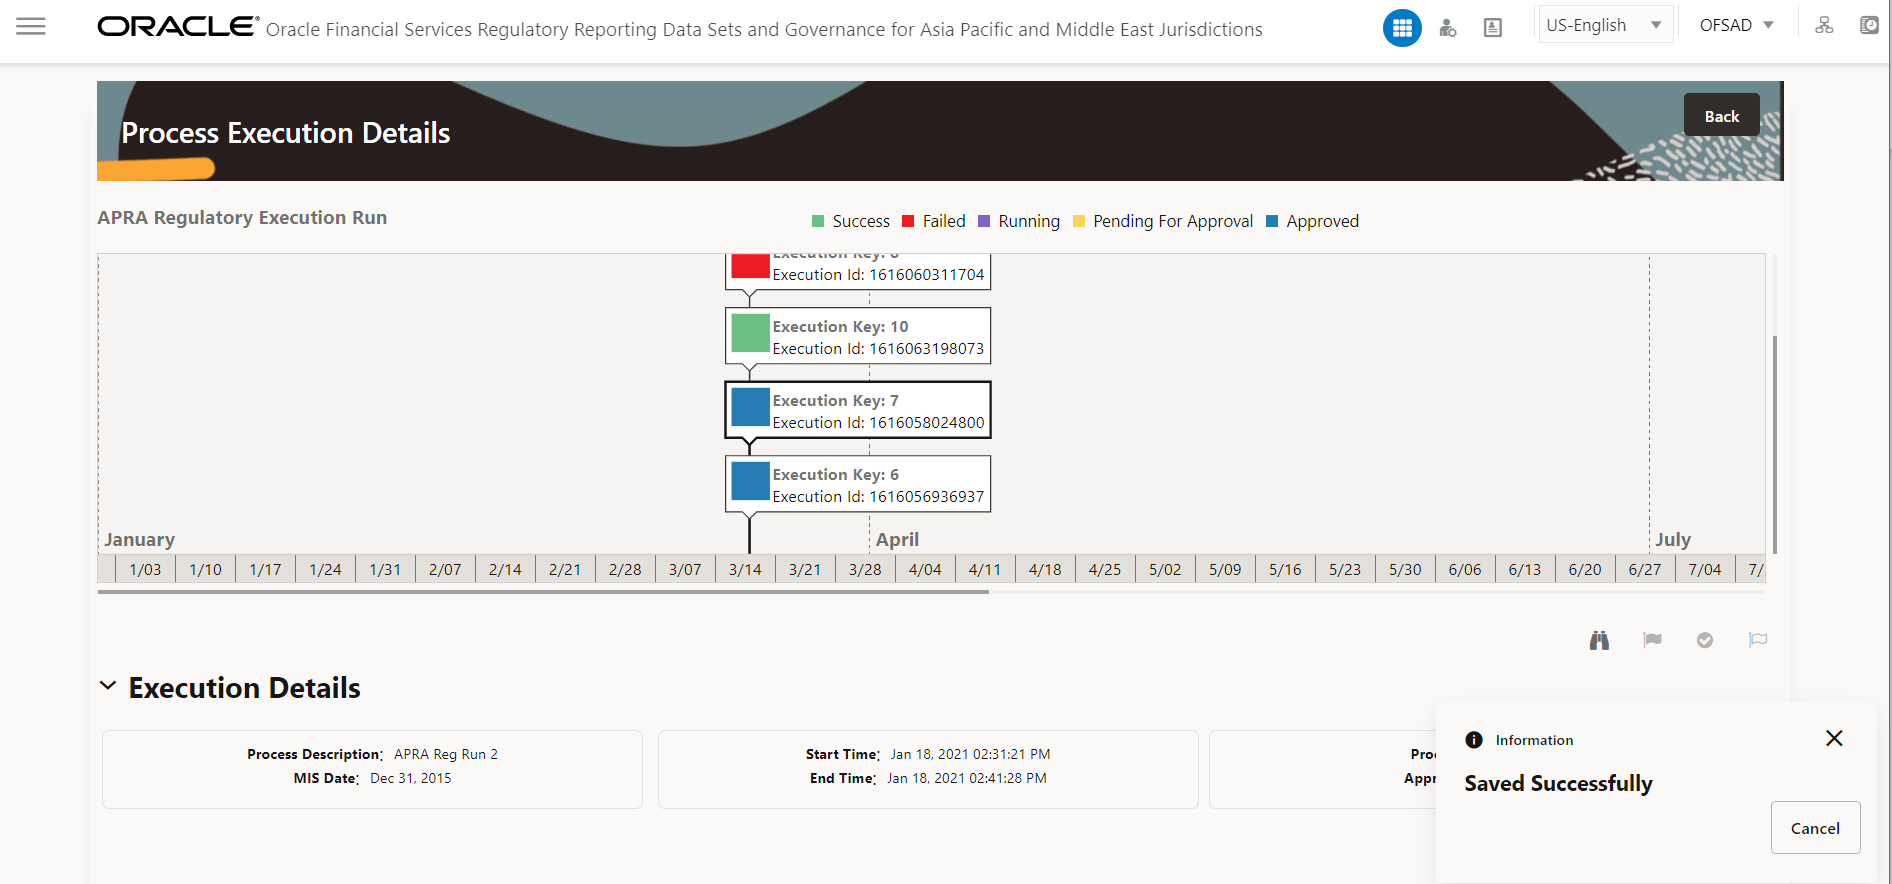
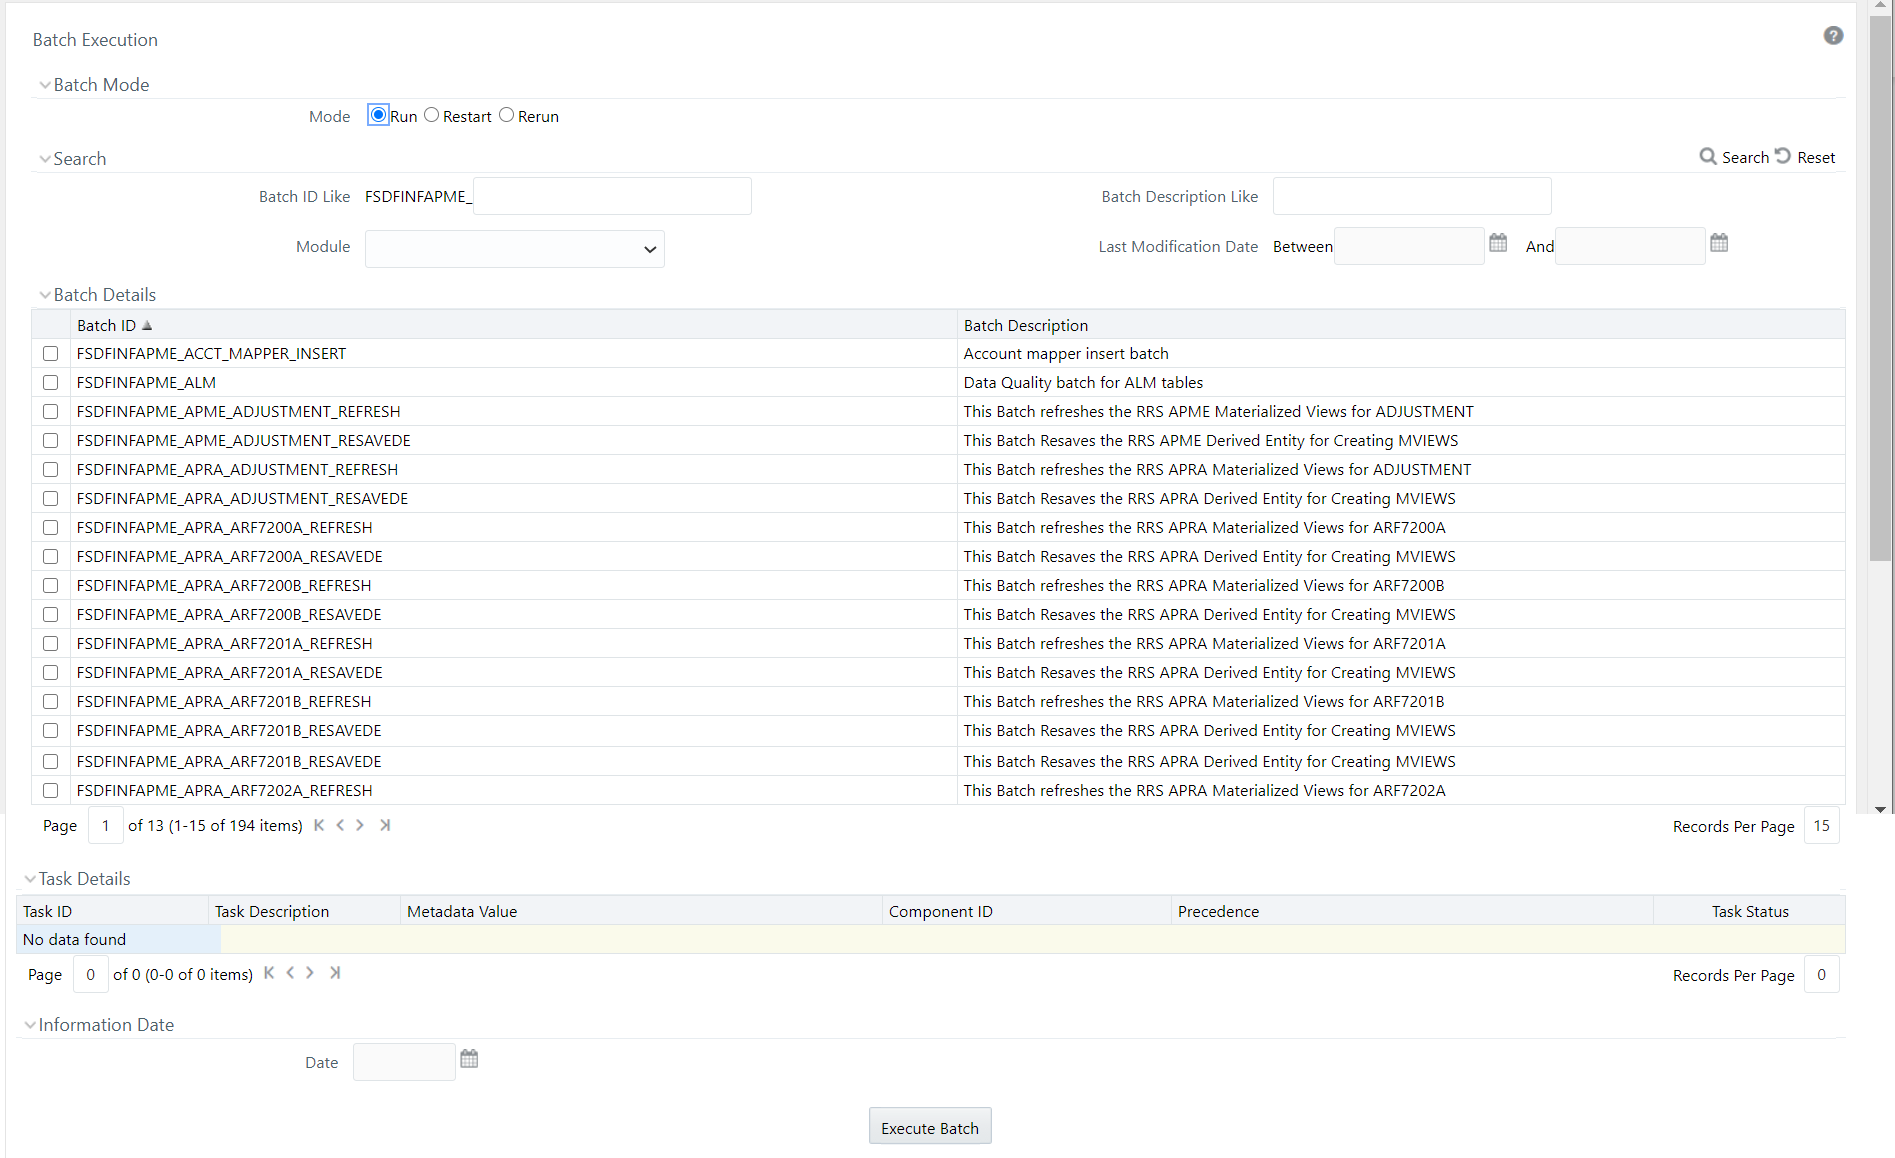
To execute the batch to resave derived entities, follow these steps:
1. After logging into the OFSAAI applications page, navigate to Oracle Financial Services Regulatory Reporting Data Sets and Governance for Asia Pacific and Middle East Jurisdictions, select Operations, and then select Batch Execution
2. Select the batch <<INFODOM>>_APRA_<<REPORT NAME>>_RESAVEDE to resave all the DEs used in that <<REPORT NAME>>.
Figure 17: Batch Maintenance Screen
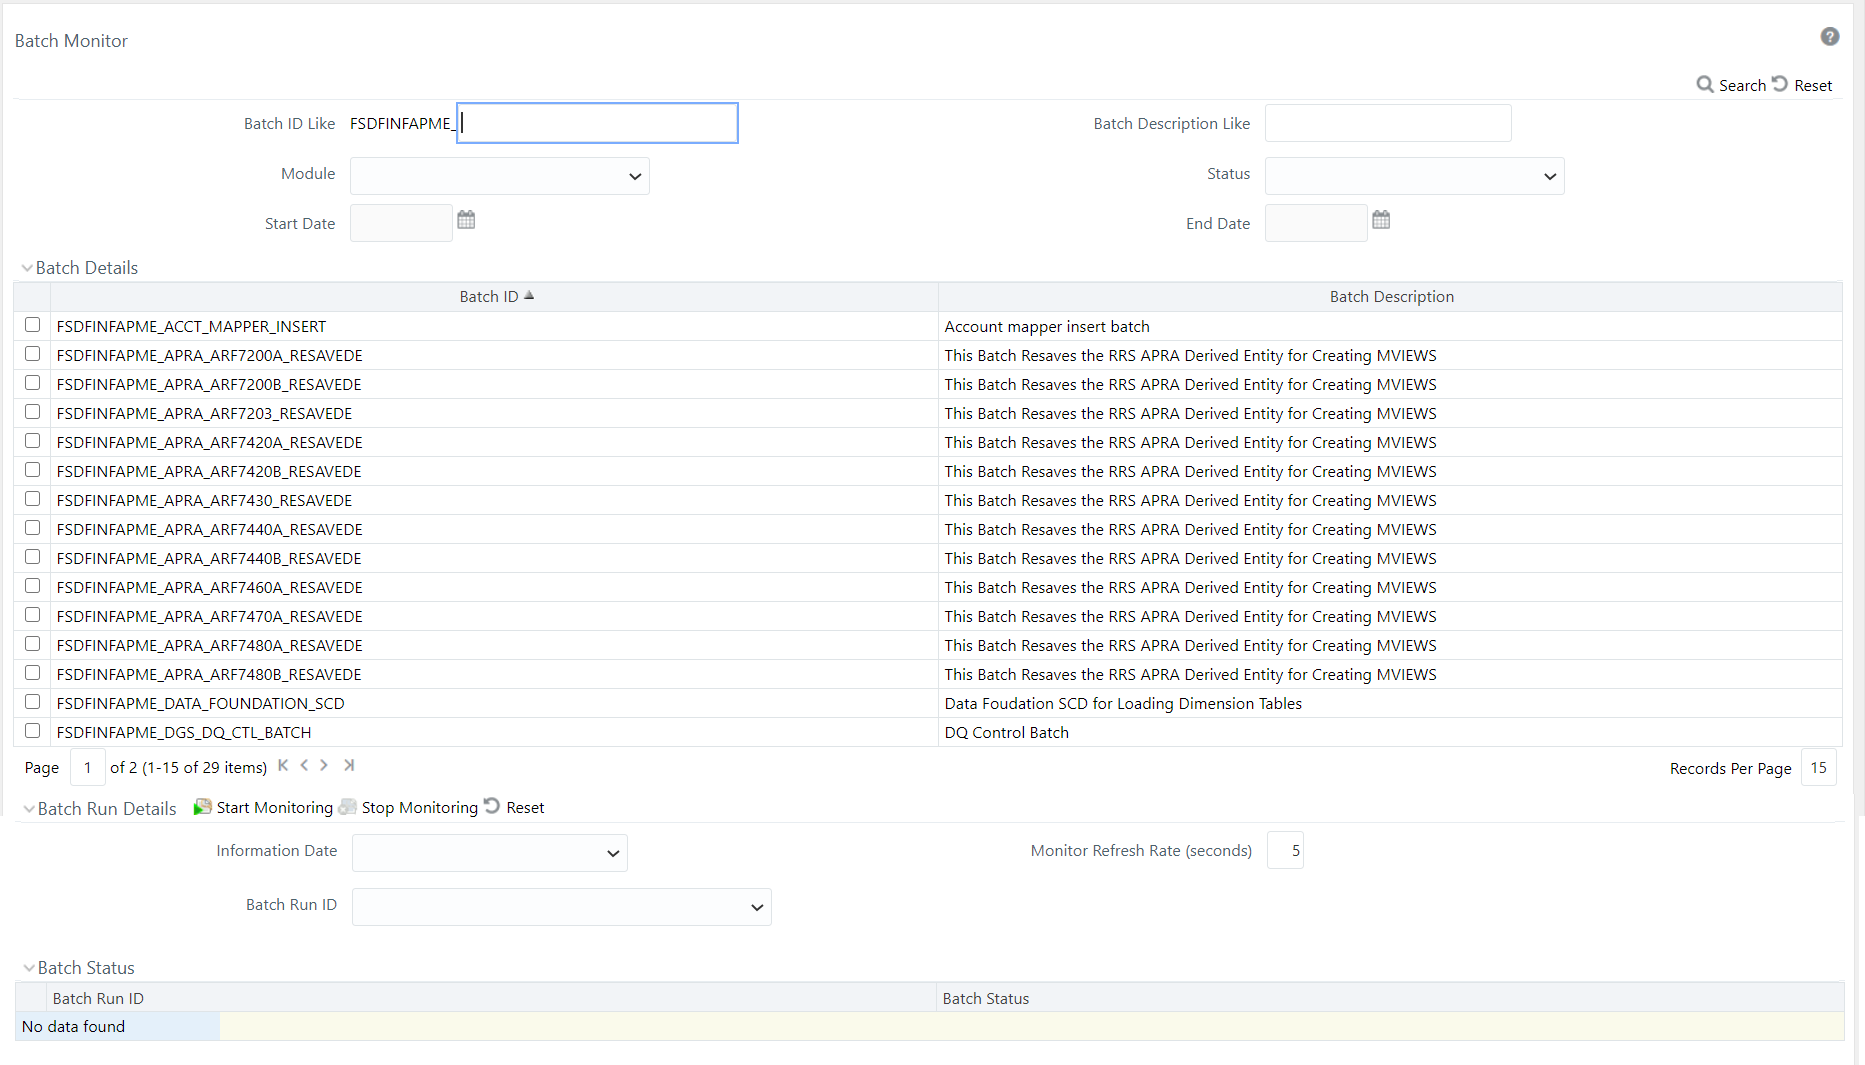
3. Monitor the status of the batch using the Batch Monitor link (Navigate to Oracle Financial Services Regulatory Reporting Data Sets and Governance for Asia Pacific and Middle East Jurisdictions, select Operations, and then select Batch Monitor).
Figure 18: Batch Monitor Screen
4. The batches available for resaving DE in this release for APRA, MAS and RBI are as follows:
§ batch_resave_de_apme_adjustments
§ <<INFODOM>>_APRA_<REPORT>_RESAVEDE
§ <<INFODOM>>_MAS_<REPORT>_RESAVEDE
§ <<INFODOM>>_RBI_RCAIII_RESAVEDE
§ The batches available for refreshing DE in this release for APRA, MAS and RBI are as follows:
§ batch_refresh_de_apme_adjustments.sql
§ <<INFODOM>>_APRA_<REPORT>_REFRESH
§ <<INFODOM>>_MAS_<REPORT>_REFRESH
§ <<INFODOM>>_RBI_RCAIII_REFRESH
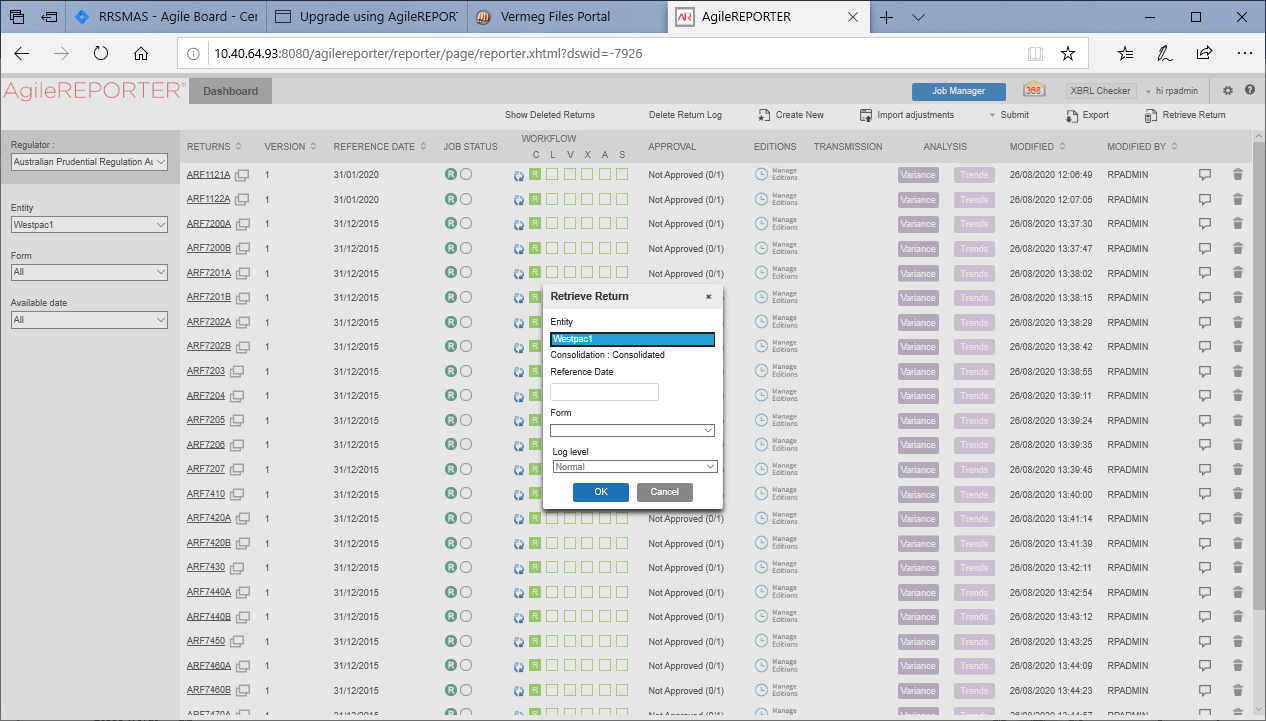
The Retrieve Return functionality in AgileREPORTER fetches data from OFSAA derived entities and embeds them on AgileREPORTER templates. This runs the decision table process in Lombard Risk. You can view the relevant OFSAA data on various schedules of the AgileREPORTER using this functionality.
Figure 19: Retrieve Returns Page
Drill-down functionality enables you to view the accounts included in the aggregation. Following these steps to drill-down from AgileREPORTER to OFSAA:
NOTE:
OFSAA user must be assigned to the RPTANALST group.
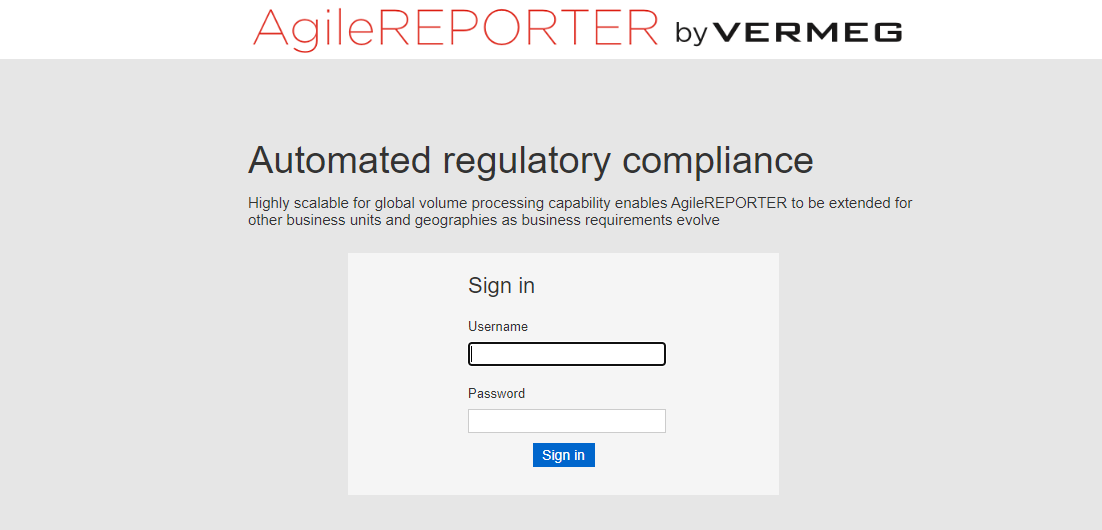
1. Log in to the AgileREPORTER.
Figure 20: AgileREPORTER Login Page
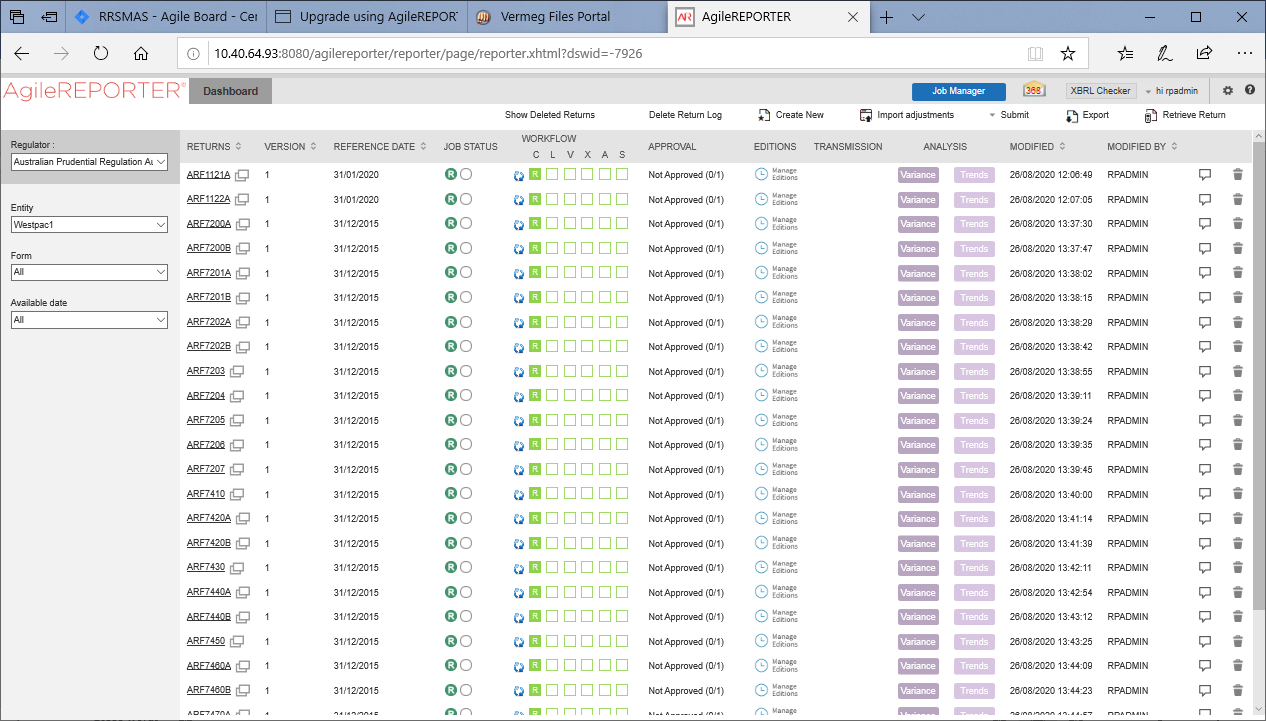
You can view the list of reports on the main page.
Figure 21: AgileREPORTER Main Page
2. Select any report name in the Returns column, for example, ARF720_0A.
Figure 22: AgileREPORTER Page Displaying List of Schedules
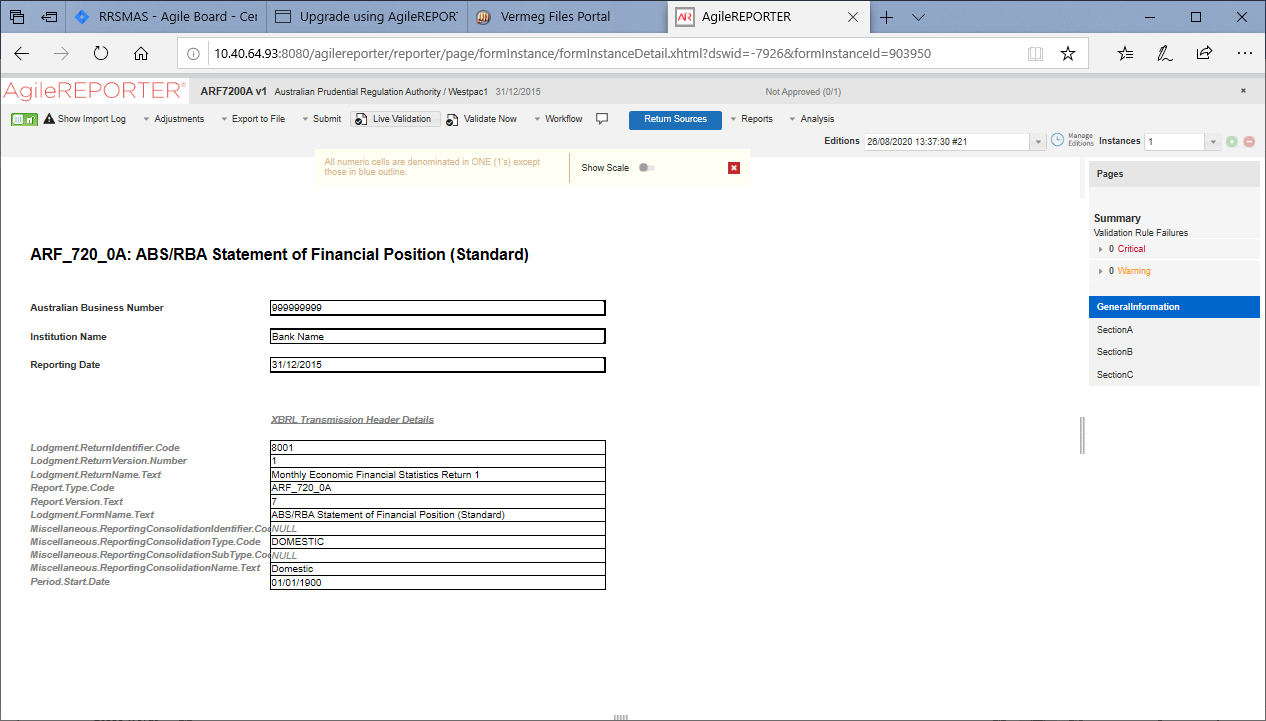
The schedule list is displayed on the right-hand side.
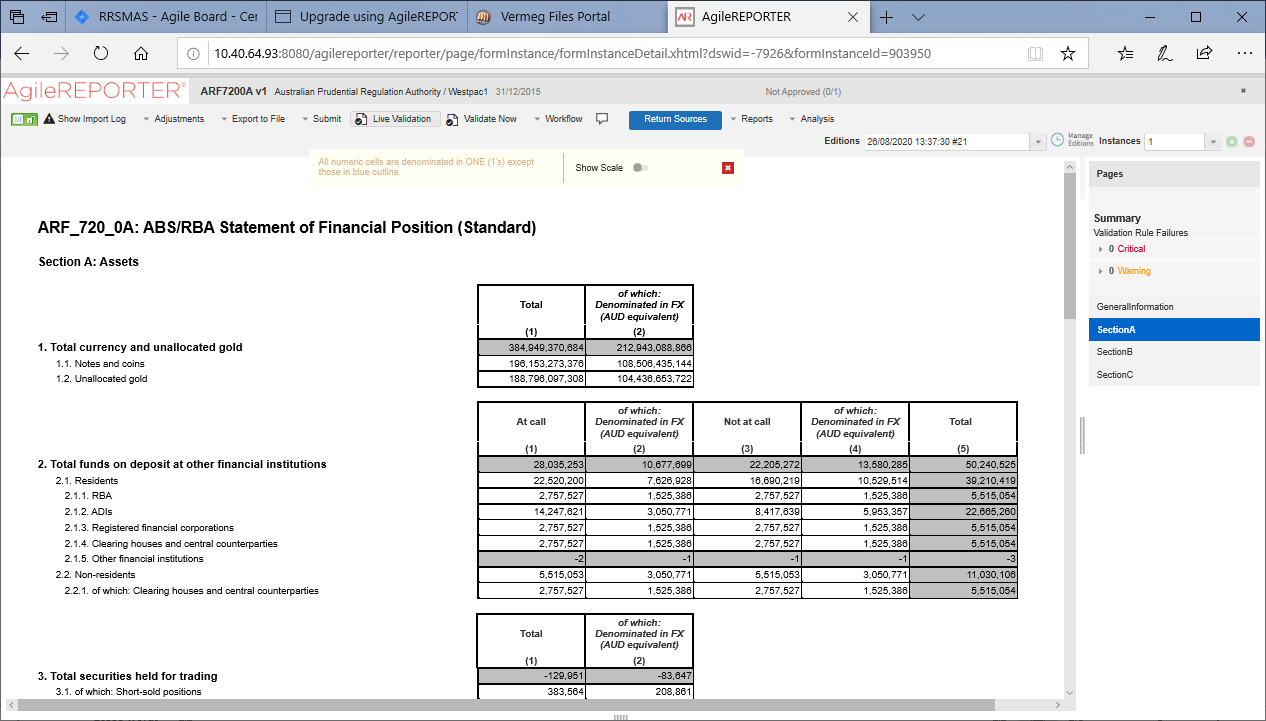
3. Select any schedule name, for example, Section A.
Figure 23: AgileREPORTER Schedule Details Page
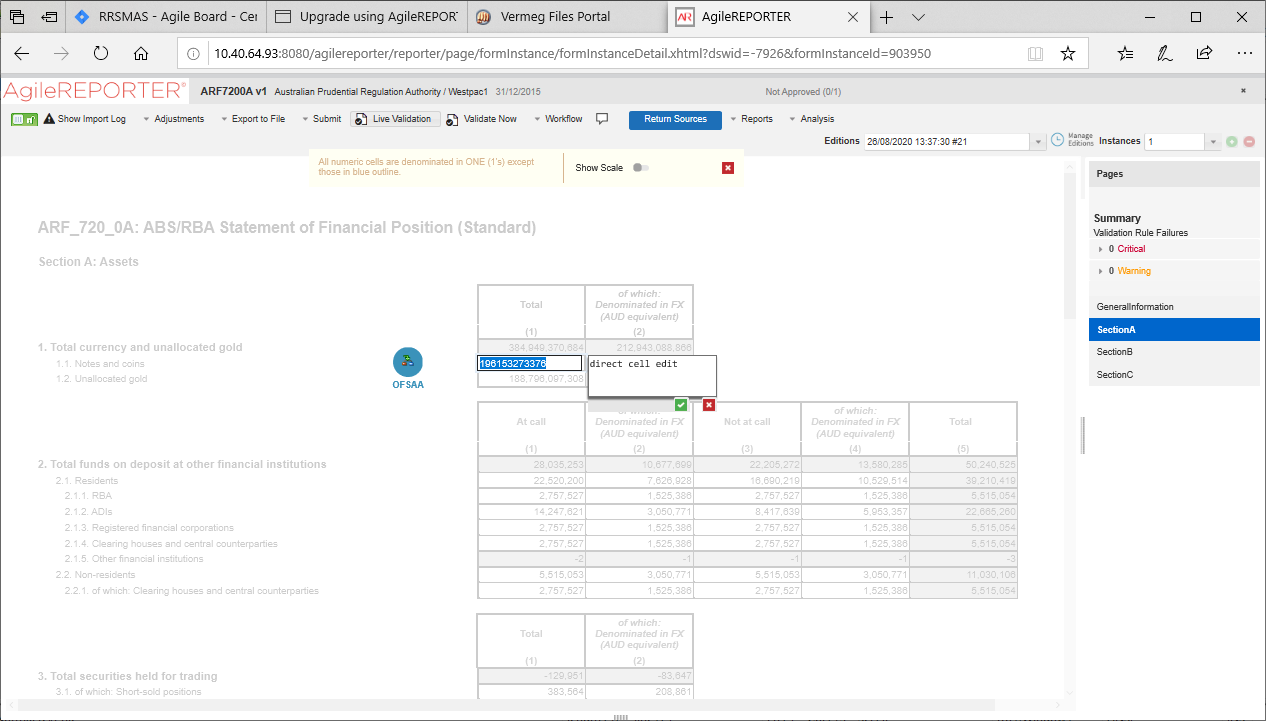
4. Click any cell to drill down. Figure 24 displays Drill down for the cell. The OFSAA icon is displayed
Figure 24: AgileREPORTER Schedule Drill Down page
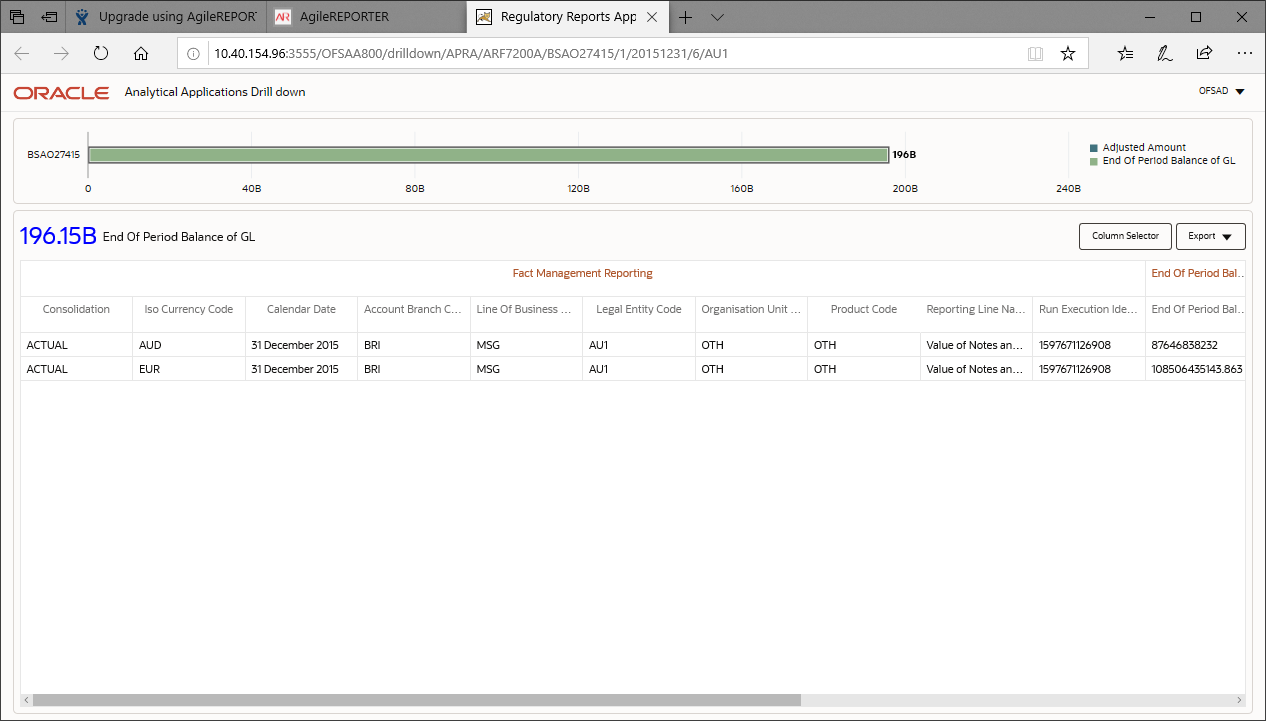
5. Click the OFSAA icon, to view how this cell was populated (provides information about the amounts reported in a cell) from OFSAA results. You are redirected to the OFSAA Drill down page.
Figure 25: AgileREPORTER Drill down Page
6. Click the Column Selector button on the header of the second table.
Figure 26: Drill down Attribute Selector
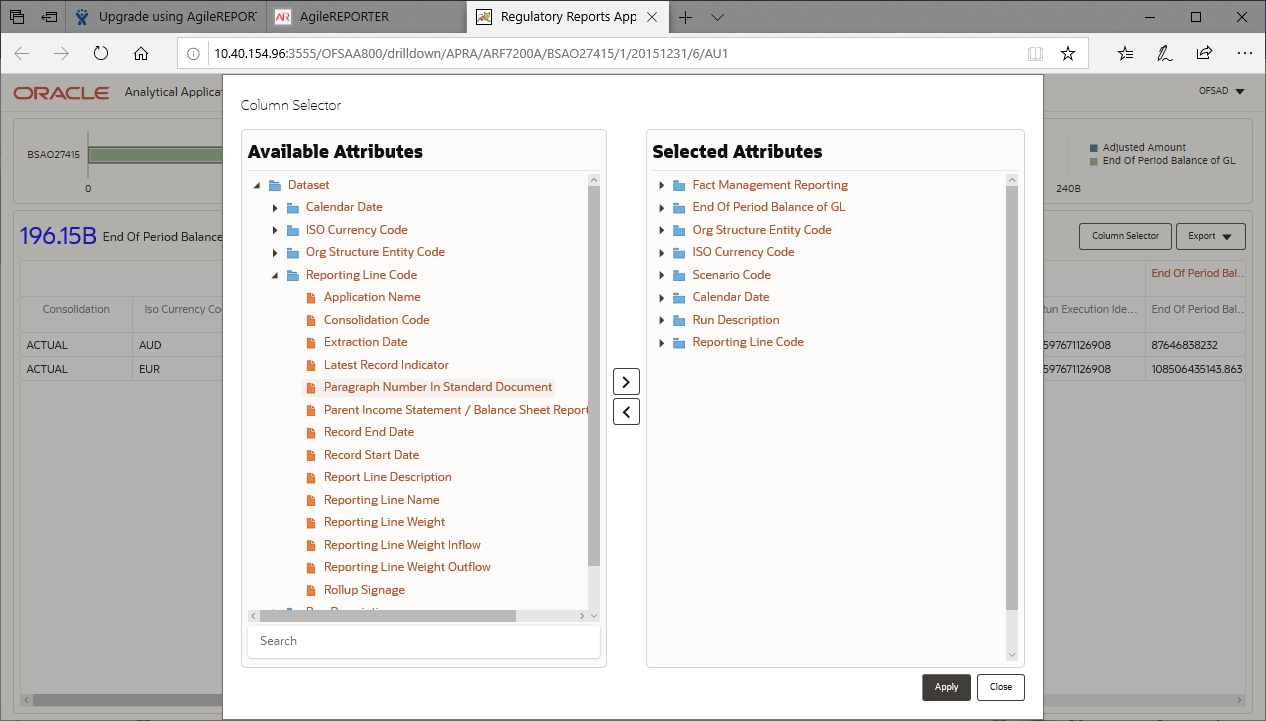
NOTE:
Select the required Data Source, from the Available
Attributes list and click Move  .
You can press the Ctrl key and click Move
  for
multiple selections to map all the listed Data Sources to the application.
Select the required Data Source, from the Selected
Attributes list and click Remove  to
remove the mapped Data Source from the application.
7. Expand Dataset and select the Attribute to be shown in the Drill down. Click Apply.
Figure 27: Drill down Columns
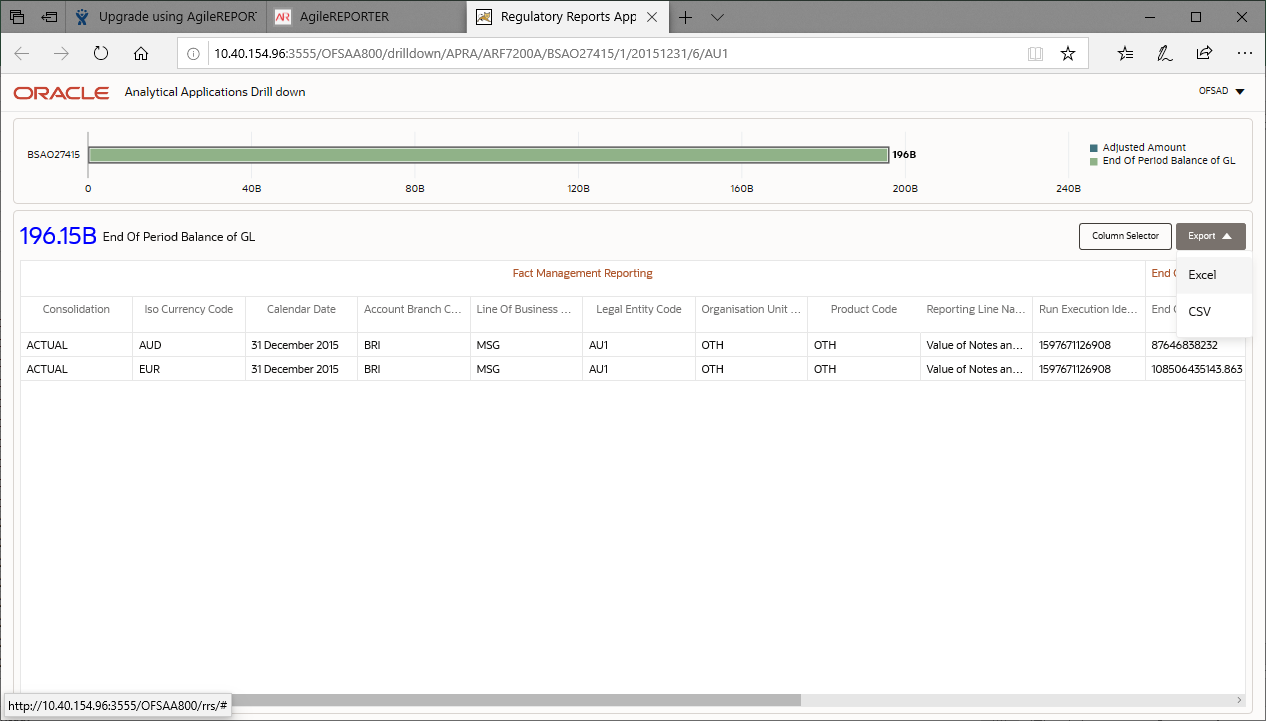
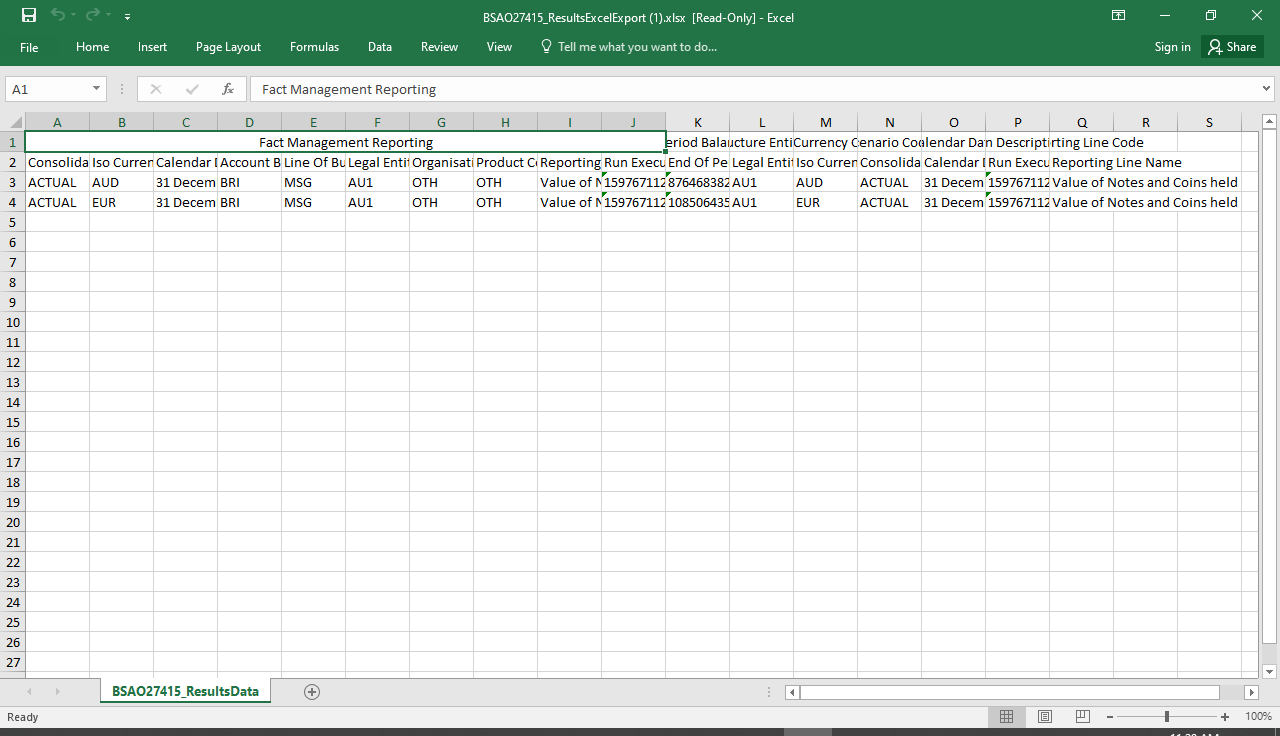
8. Click Export to export the report details.
Figure 28: Exported Report Details
This section helps you to navigate through the Metadata Browser and guides you in tracing the source of the metadata. The Metadata Browser function allows you to view and analyze all aspects of the metadata used in the OFSAAI. It provides extensive browsing capabilities of metadata, helps in tracking the impact of changes to metadata, and trace through to the source of originating data.
Metadata Browser (Object and Application View) provides a common repository of metadata objects created in OFSAAI and applications hosted in OFSAAI. Using this view, you can identify the usage of base objects in higher-level objects and the mapping of Objects to Application, thus enabling traceability. It also allows you to view the data flow and the workflow of the application and understand the usage of objects within the application.
The new visualization of Metadata Browser (MDB) supports the Application view and Object view. In the Application view, you can browse through the metadata created using the applications hosted in OFSAAI. In the Object view, you can view the metadata created in OFSAAI.
To access the Metadata Browser (Object and Application Views), your role must be mapped to the SCR_MDB function.
Analysts review the metadata used for a particular report schedule to verify the data. Data verification may require looking for metadata used in a given schedule or it can be scheduled in which particular metadata is used. Data Analysts and Reporting Analysts perform the report verification. Metadata refers to business measures, hierarchies, Datasets, derived entities used for a given schedule.
To use MDB for schedule-wise metadata, and to use MDB for metadata wise schedule, identify the metadata used, perform the following steps:
1. You can verify the data for related data elements in results using this information. Navigate to Catalog of Objects, select OFSAA Metamodel, select Reporting Metadata, and then select Reports. The MDB Reporting Metadata screen is displayed.
Figure 29: MDB - Reporting Metadata Page
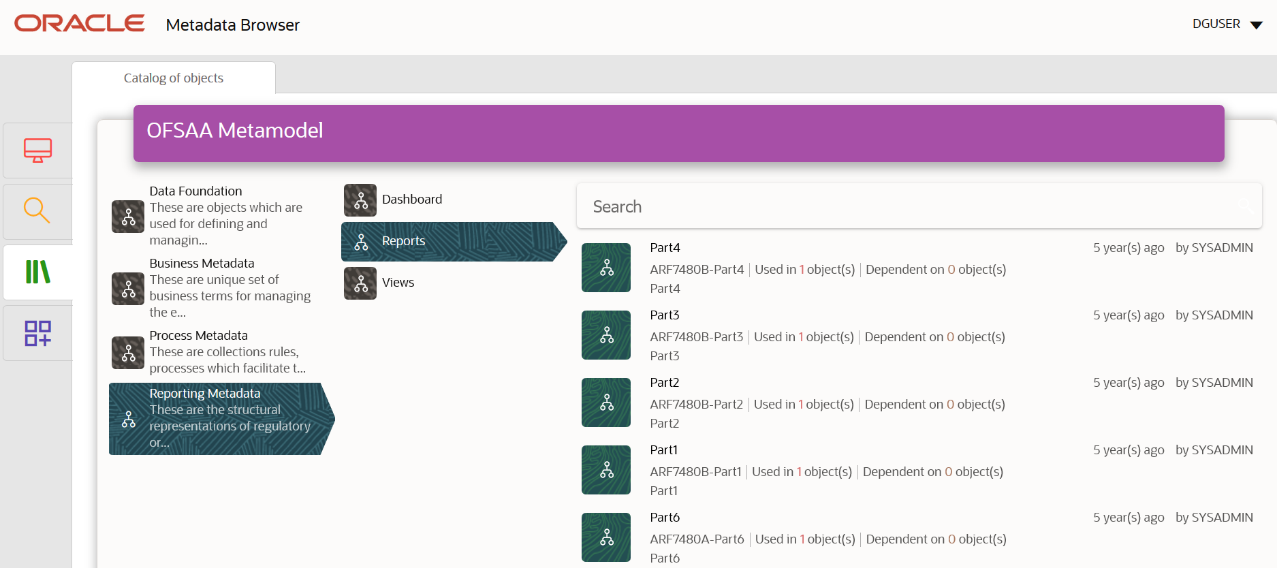
2. Click the object view ARF7480B to view the list of schedules. The Reporting Metadata Schedule View page is displayed.
Figure 30: MDB - Reporting Metadata - Schedule View
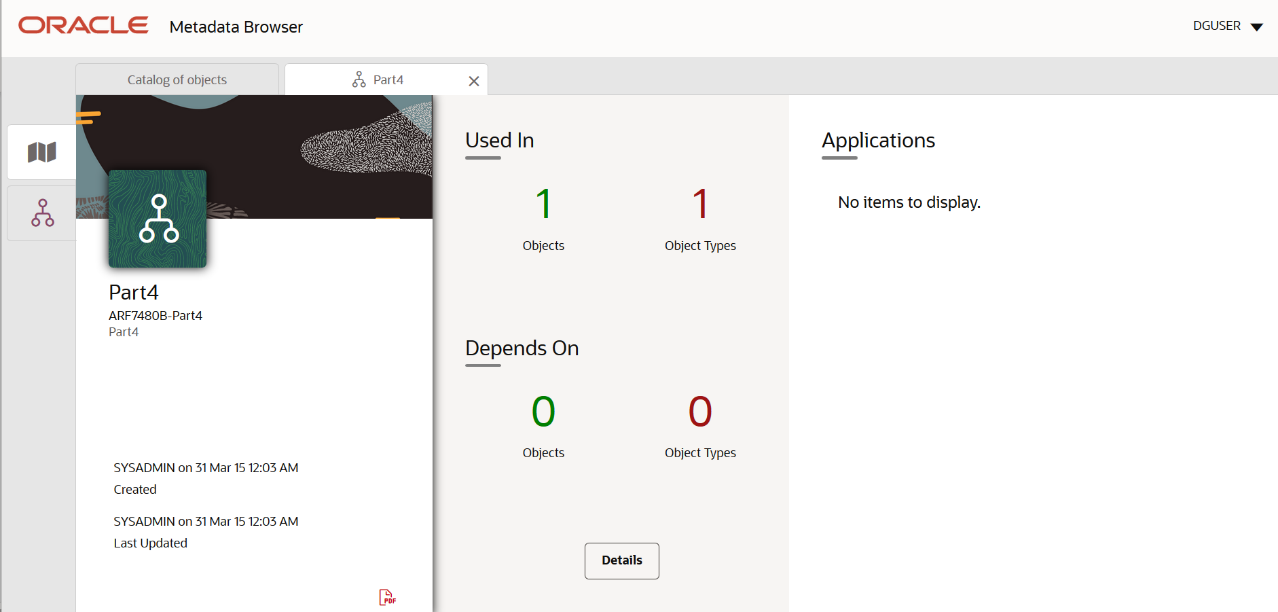
You can view the following information in the Schedule Details page:
§ Depends On: This section displays the metadata used in a given schedule.
§ Used In: This section displays the Reports in which this schedule is used.
§ Applications: This section displays the applications in which this schedule is used.
3. Click Details to view the dependency and usage information such as the Object Name and the Object Type.
Figure 31: MDB - Reporting Metadata - Schedule View 1

4. From the Schedule View page, click the Dependency tab to view the report tree structure.
Figure 32: MDB - Reporting Metadata Tree Structure Page

Starting from common metadata used across the application, you may want to know the list of reports or derived entities this metadata has used. Let us take an example of a measure. To identify how value is computed, perform the following steps to trace it back to the metadata.
This section provides information on the Business metadata objects which include Base Metadata and Derived Metadata.
The following are the steps to perform to view the Base metadata details. For example, Measures.
1. To view the measures, navigate to Catalog of Objects, select OFSAA Metamodel, select Business Metadata, select Base Metadata, and then select Measures. The MDB Business Metadata page is displayed.
Figure 33: MDB - Business Metadata - Measure View Page
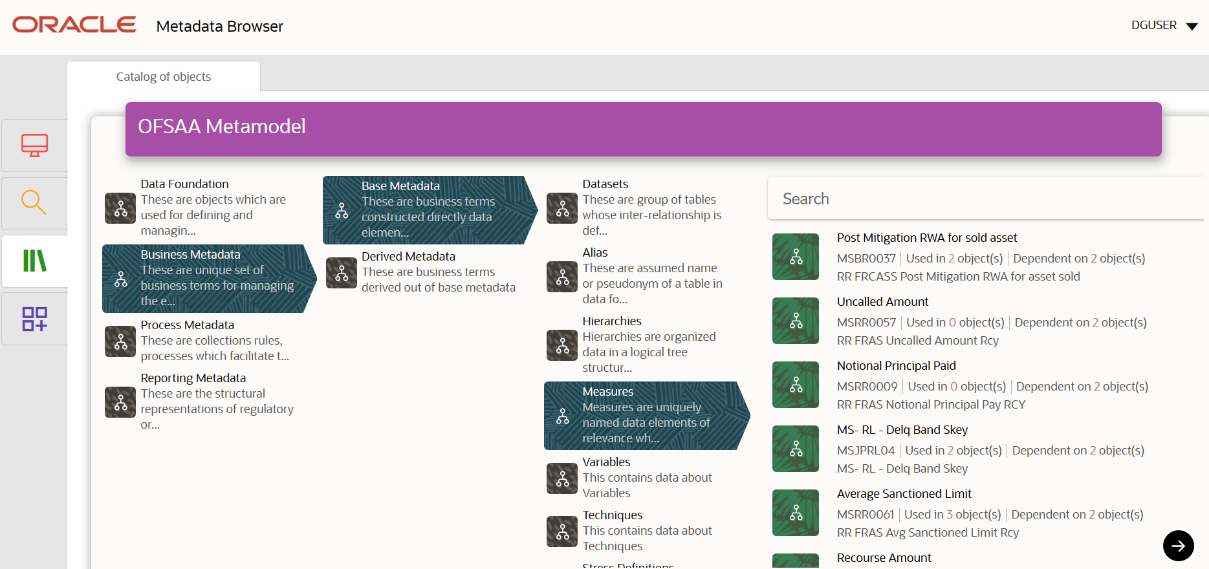
2. Click the Measure that you wish to view. The MDB Business Metadata Measure Details page is displayed.
Figure 34: MDB - Business Metadata Measure Details Page
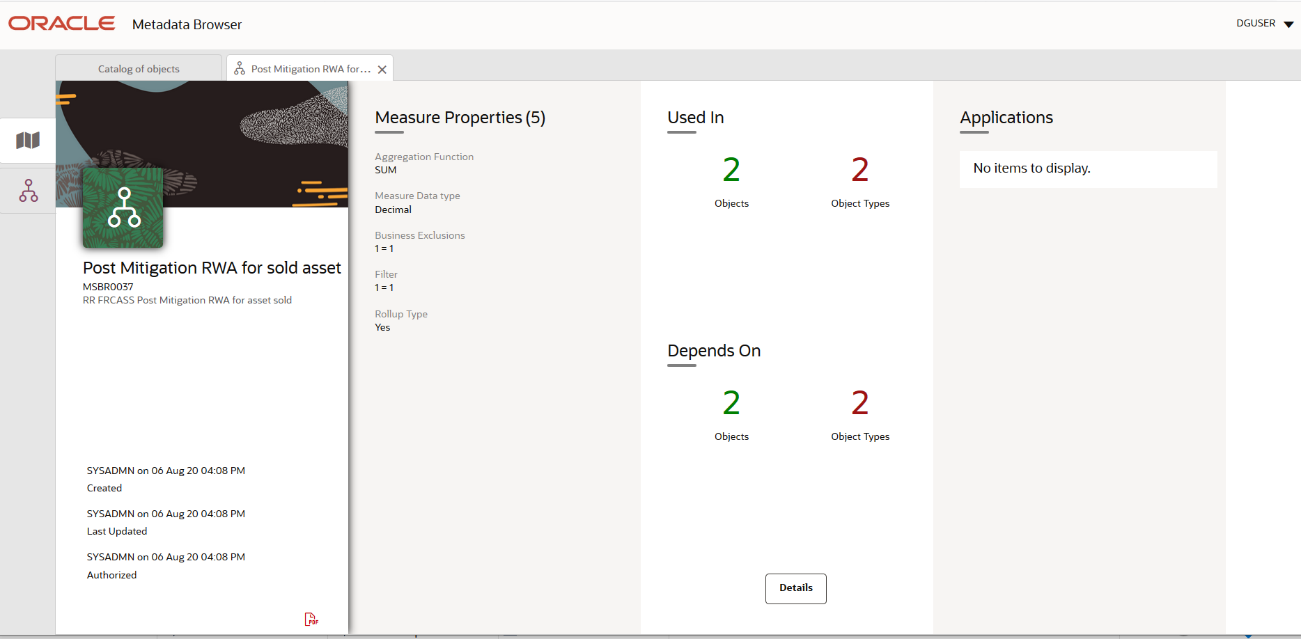
You can view the following information on this page:
§ Measure Properties: It provides information on the properties of Business measures. For example, aggregation function, Measure Data Type, Business Exclusions, Filter, and Rollup Type.
§ It depends on: This section displays all the object names and their types, such as Entities, Columns, and so on.
§ Used In: This section displays the Objects in which this schedule is used.
§ Applications: This section displays the applications in which this schedule is used.
3. Click Details to view the measure dependency and usage information.
Figure 35: Measure Dependency and Usage Details Page

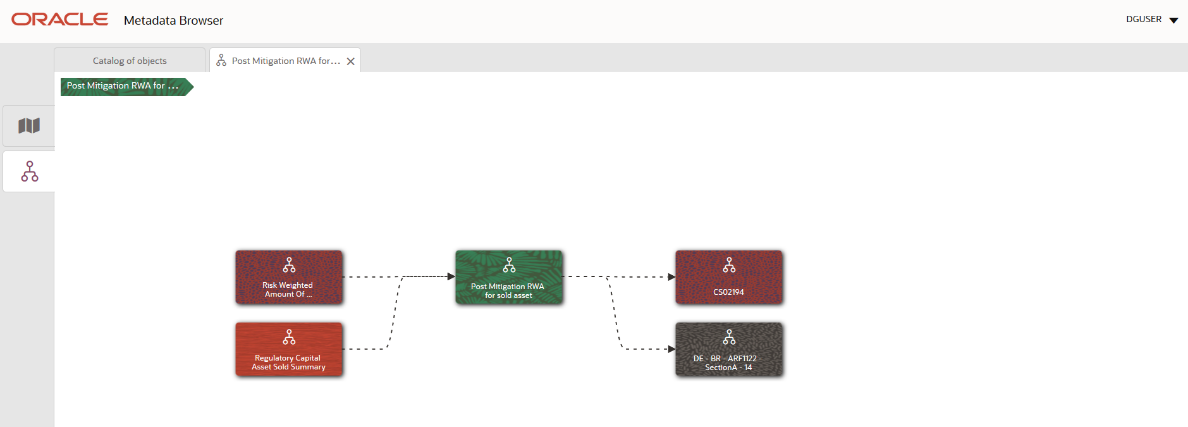
4. From the Measure Details page, click the Dependency tab to view the measure tree structure.
Figure 36: Business Metadata Measure Tree Page
NOTE:
The similar steps as mentioned in this section are applicable for other metadata such as Business Metadata (Hierarchies, Measures, Variables, and so on) and Derived Metadata (Dimensions, Filters, and so on), Process Metadata (Process, Rules, and so on) and Data Foundation (Target Model, Sources, Connectors, and so on).
The following are the steps to perform to view the Derived Metadata details. For example, Derived Entities.
1. To view the schedule-wise derived entities, navigate to Catalog of Objects, select OFSAA Metamodel, select Business Metadata, select Derived Metadata, and then select Derived Entities.
Figure 37: MDB - Business Metadata Derived Entity Page
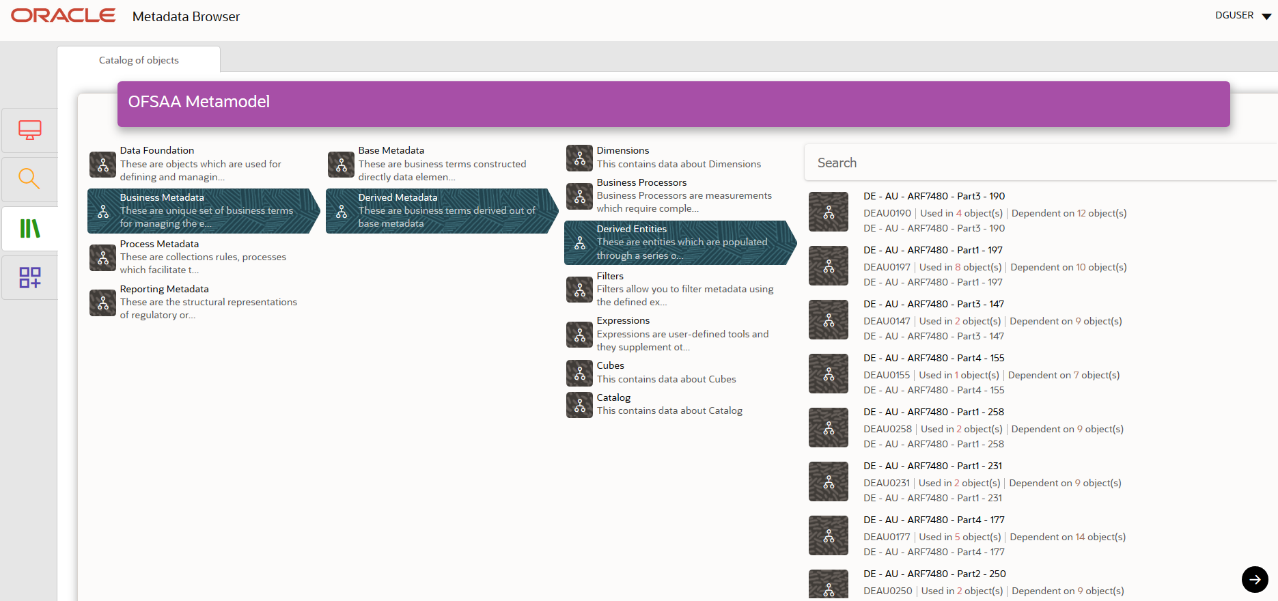
2. Click the Derived Entity that you wish to view. The Derived Entity Details page is displayed.
Figure 38: Derived Entity Details Page
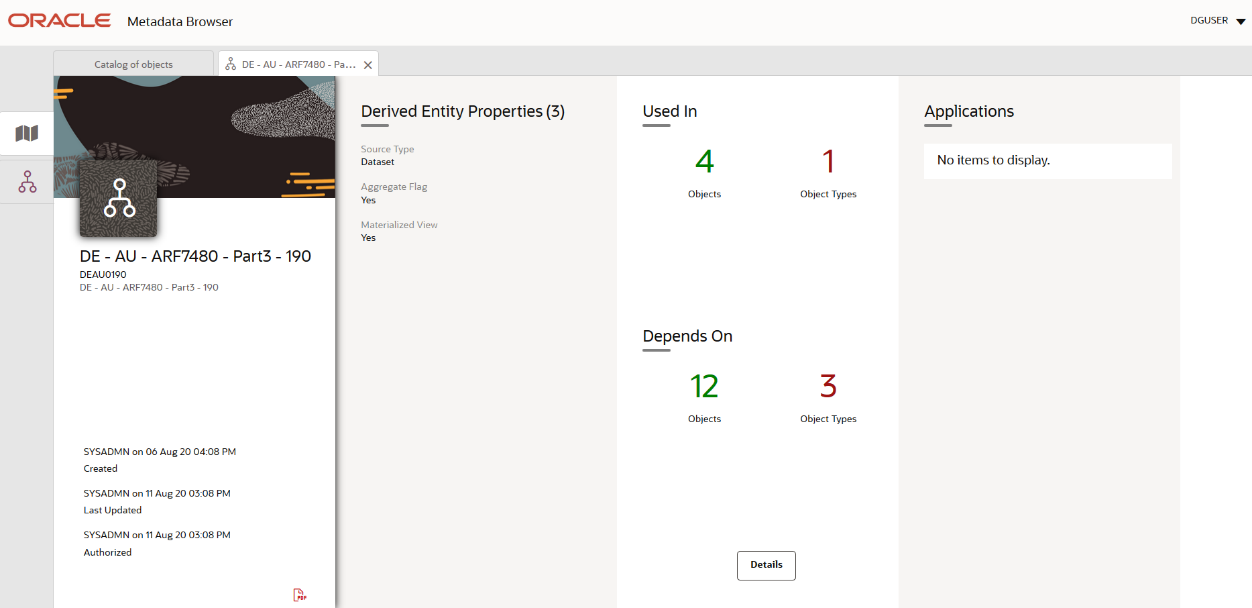
You can view the following information on this page:
§ Derived Entity Properties: It provides information on properties of derived entities, such as Source Type, Aggregate Flag, and Materialized View.
§ It depends on: This section displays all the object names and their types, such as Dataset, Hierarchy, and so on.
§ Used In: This section displays the Objects in which this schedule is used.
§ Applications: This section displays the applications in which this schedule is used.
3. Click Details to view the derived entity dependency and usage information.
Figure 39: Derived Entity Dependency and Usage Page
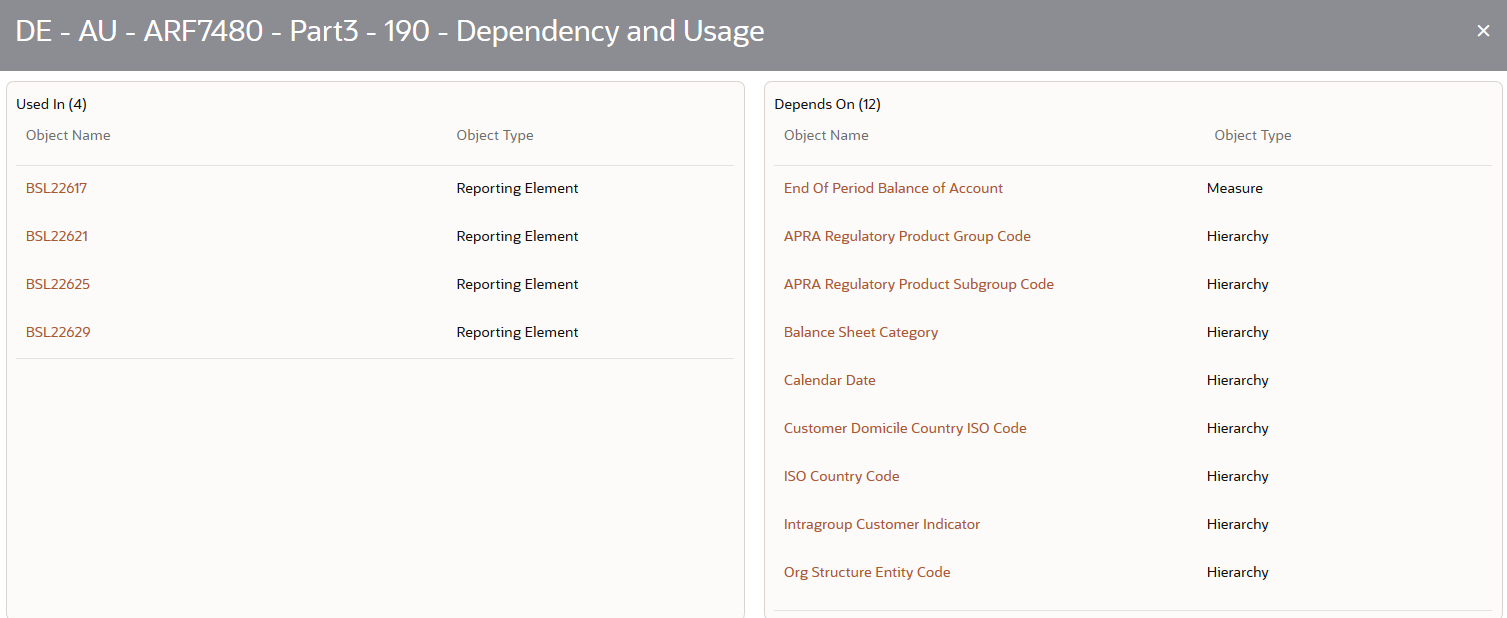
4. From the Derived Entity Details page, click the Dependency tab to view the Derived Entity tree structure.
Figure 40: Derived Entity Tree Structure Page
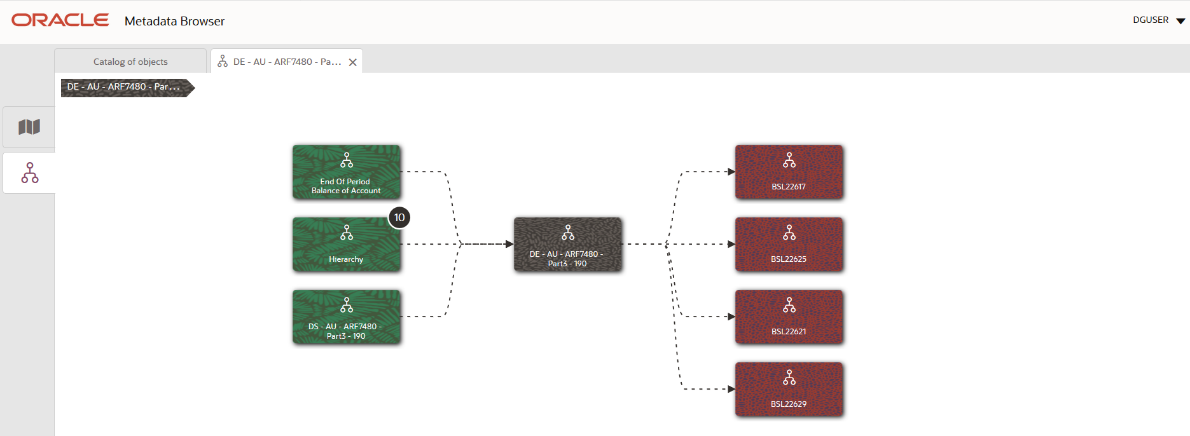
For more information about the Metadata and its usage, see the OFSAA Metadata Browser User Guide.
Business terms are individual terms present in a glossary. It includes a definition and several attributes that provide a complete description of the glossary.
Additionally, Business Terms provide associated knowledge, such as the user responsible for the term, the associated metrics, correct usage of the term, related terms, list of possible values for the term, and so on. OFSAA Glossary includes all the terms related to risk, performance, compliance, and insight pre-packaged with all the relevant information in them.
All users are required to be mapped to the DGSAUTHGRP, DGSADMINGRP, and DGSANALYSTGRP groups along with their respective groups.
The following is the user role for Business Terms:
· Business Term Viewer: Permits the user to view the Business Terms.
To view a Business Term, follow these steps:
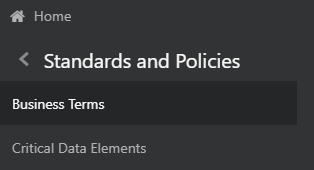
1. From the Regulatory Reporting Data Sets and Governance for Asia Pacific and Middle East Jurisdictions window navigate to Standards and Policies and select Business Terms.
Figure 41: Standards and Policies Business Terms
2. The Business Terms window is displayed.
Figure 42: Business Terms
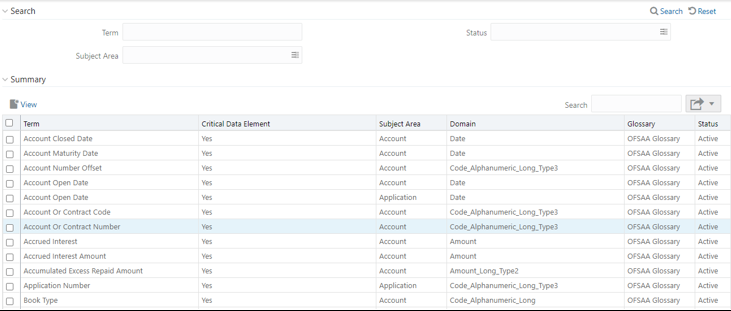
3. In the Search section, enter the search details and click
 to
view the results in the summary table.
4. Enter the required Business Term.
5. Select the Status from the drop-down list. The status can be Draft, Pending Approval, or Active.
6. Select the Subject Area from the drop-down list.
Figure 43: Business Terms Search

7. To view a
Business Term, select a Business Term from the Summary table and click
 icon.
icon.
Figure 44: Business Terms - View

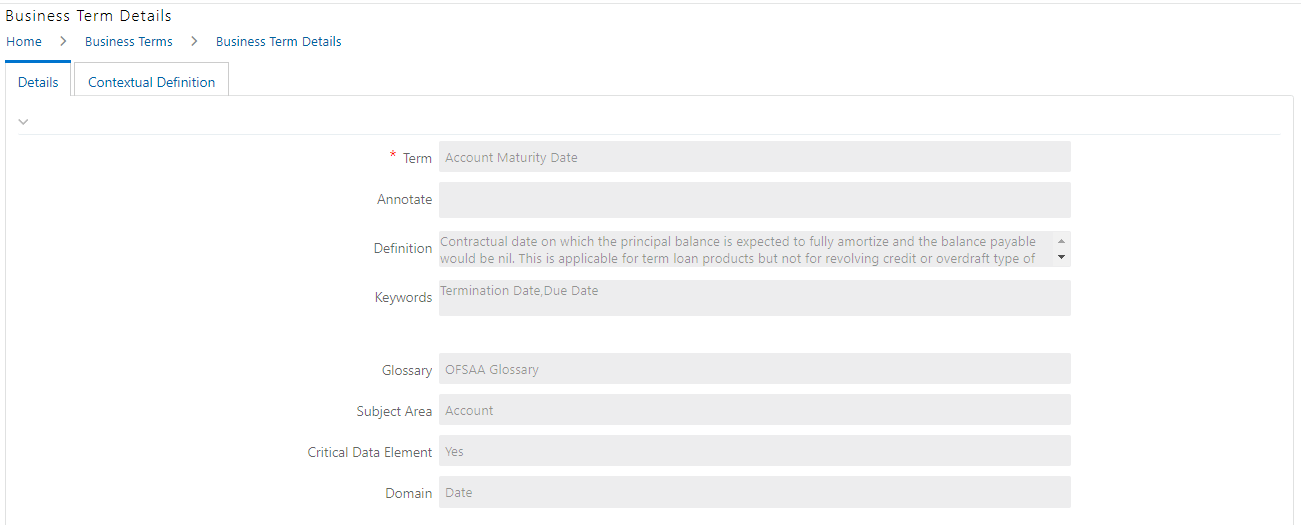
8. In the Business Term Details window, you can view the following Details:
Fields |
Description |
|---|---|
Term |
Name of the Business Term. |
Annotate |
A reference text for additional information on Business Term. |
Definition |
Brief description of the Business Term. |
Keywords |
Values to be used as keywords that are used to search the Business Term. |
Glossary |
Glossary Name. |
Subject Area |
Subject Area Name. |
Critical Data Element |
Glossary term is a critical data element or not. |
Domain |
Alphanumeric, Date, or Numeric. |
Figure 45: Business Term Details
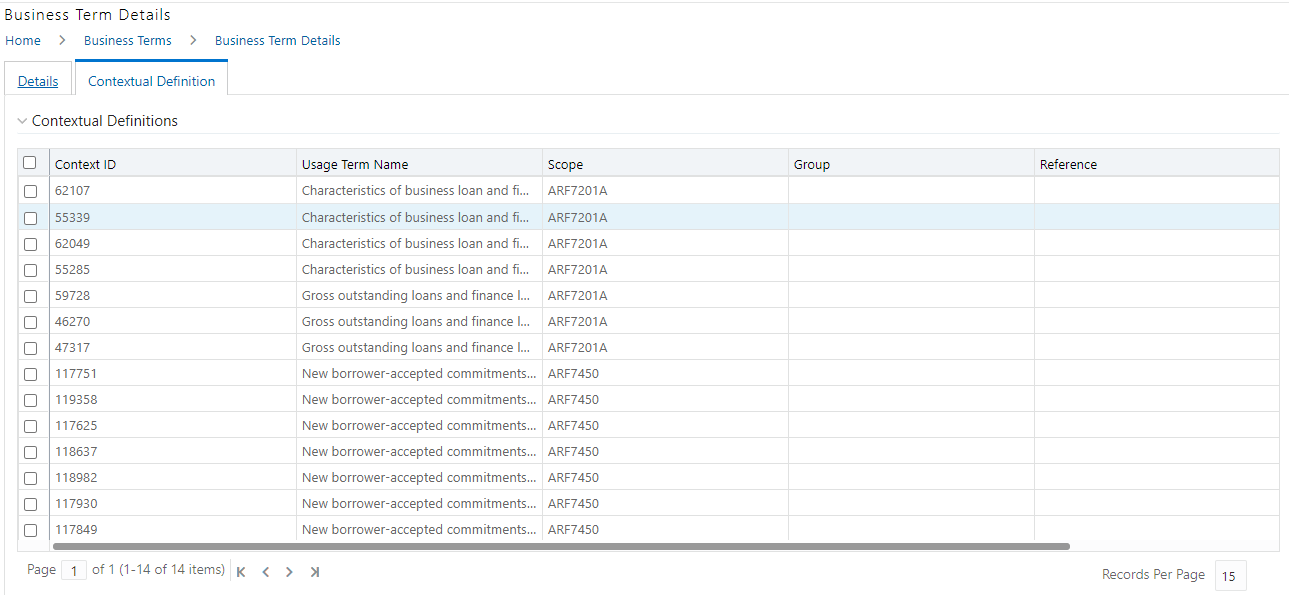
9. In the Contextual Definition window, you can view the following details:
Fields |
Description |
|---|---|
Context Name |
Related to other glossary identifiers (multiple contextual definitions for the glossary term). |
Context Definition |
Contextual definition of the glossary term from the perspective of source or application. |
Context ID |
A system-generated number. |
Usage Term Name |
The name of the context in which the term is used. |
Figure 46: Business Term Contextual Definition
10. You can also view the Related Business Terms and List of Values associated with the Business Term.
11. The definition of Business Terms is generally designed to produce a common understanding of the meaning of the term for the entire organization irrespective of the business function. These are standard definitions and do not define the usage of the term in a specific context.
12. The Usage Term of Business Terms explains the terminology in the context of its usage. A terminology can have one or more usage terms based on the number of use cases that it applies to in the organization. Each usage of that particular term has its explanation of how and why it is used, along with the list of values for that specific context.
Figure 47: Related Business Terms and List of Values

13. In the Summary Table, you can search for a particular Business Term from the summary table.
14. For example, enter a search keyword Code, the table lists the results with the matching keyword.
Figure 48: Business Terms Search

15. To export
the summary table into an Excel or CSV file, in the Summary Table, click
the Export drop-down  . This downloads Business
Term Summary details.
Critical Data Elements are Business Terms that are critical for a specific business process. These terms and their values are vital and significant for specific processes, for example, regulatory reporting or management reporting.
These data elements are marked critical as per their context, justification, level of criticality, and approval for the classification. They are ensured to have additional rigor in their data quality checks, controls, and so on and have sufficient metrics around it to ensure timeliness and accuracy of the values.
Critical Data Elements (CDEs) are defined for each report in Regulatory Reporting. DGAPRA contains all CDEs for a particular report. The list of Critical Data Elements is identified for a particular report and the level of criticality will be defined and is stored in the FSI_GL_CDE_DETAILS table. These elements are monitored for accuracy and consistency of data within the Key Indicator and Control section.
All the users are required to be mapped to the DGSAUTHGRP, DGSADMINGRP, and DGSANALYSTGRP groups along with their respective following groups.
The following is the user role for critical data elements:
· Critical Data Elements: Permits the user to view the critical data elements.
To view a Critical Data Element, follow these steps:
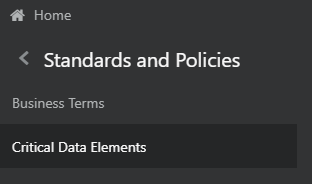
1. From the Regulatory Reporting Data Sets and Governance for Asia Pacific and Middle East Jurisdictions, window navigate to Standards and Policies and select Critical Data Element.
Figure 49: Standards and Policies - Critical Data Element
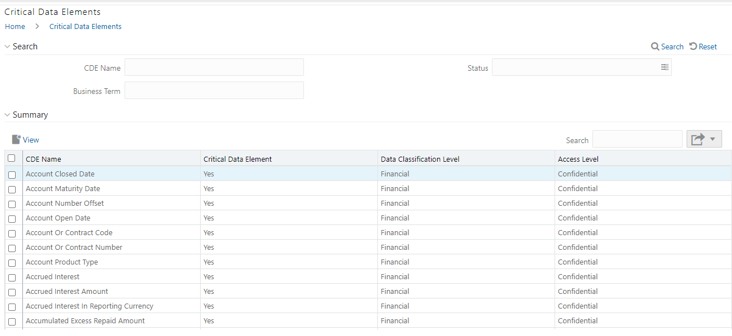
2. The Critical Data Element window is displayed.
Figure 50: Critical Data Element
3. In the Search section, enter the search details and click
 to
view the results in the summary table.
4. Enter the required CDE Name.
5. Select the Status from the drop-down list. The status can be Draft, Pending Approval, or Active.
6. Enter the Business Term.
Figure 51: Critical Data Element Search

7. To view a
CDE, select a CDE Name and click  icon.
icon.
Figure 52: Critical Data Element View

8. In the Critical Data Elements Details window, you can view the following details:
Fields |
Description |
|---|---|
CDE Name* |
CDE Name. |
Business Term* |
Business Term Name. |
Access Level* |
Access level: Public Confidential Restricted |
Data Classification Level* |
Data classification level from the drop-down list: Legal Financial PHI PII |
Figure 53: Critical Data Elements Details

9. You can also view the Entity Attribute Details associated with the CDE.
Figure 54: Entity Attribute Details

10. In Summary Table, you can search for a particular CDE from the table.
11. For example, enter a search keyword Code, the table lists the results with the matching keyword.
Figure 55: Critical Data Element Search

12. To export
the summary table into an Excel or CSV file, in the Summary Table, click
the Export drop-down  . This downloads the CDE Summary
details.
The Key Indicator Assessment configuration UI helps the user to control the Report or Schedule or Cell to be processed for Variance analysis and Dashboard reporting. The UI also helps to update threshold breach percentage values alongside.
All the users are required to be mapped to the DGSAUTHGRP, DGSADMINGRP, and DGSANALYSTGRP groups along with their respective following groups.
The following is the user role for key indicators:
· DG Administration: Permits the user to view and edit the key indicator assessment configuration.
To configure the key indicator, follow these steps:
NOTE:
By default, all the reports are included.
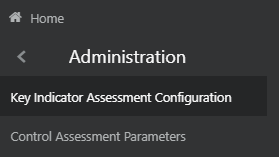
1. From Regulatory Reporting Data Sets and Governance for Asia Pacific and Middle East Jurisdictions, window navigate to Administration and select Key Indicator Assessment Configuration.
Figure 56: Key Indicator Assessment Configuration
2. The Key Indicator Assessment Configuration window is displayed.
Figure 57: Key Indicator Assessment Configuration
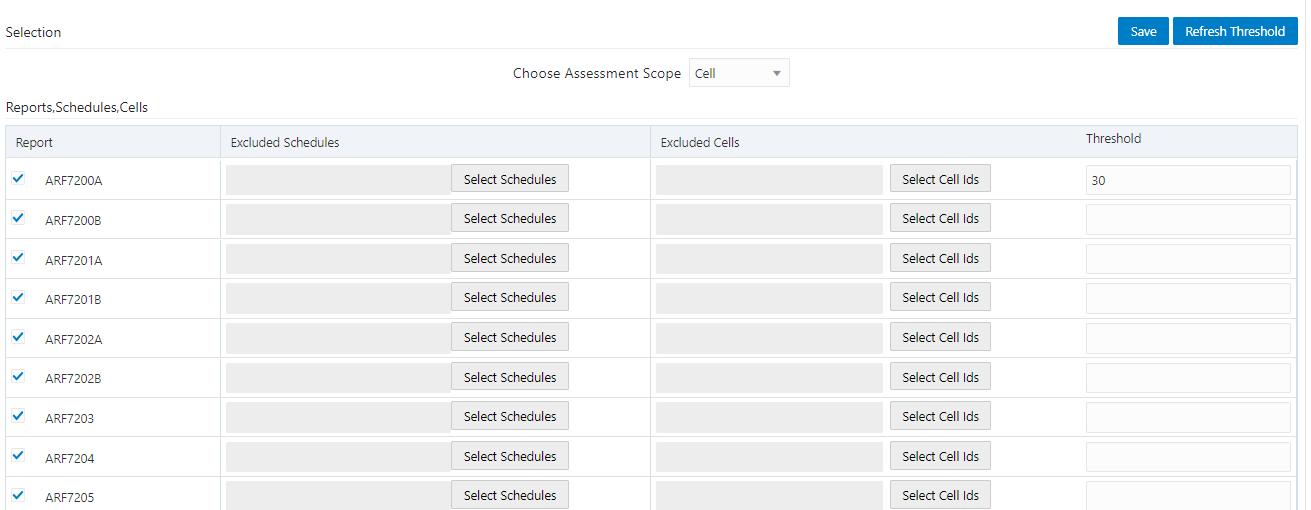
3. In the KI Assessment Configuration section, in the Report column, select the checkboxes for the reports whose schedules and cell IDs you want to exclude.
The Select Schedules and Select Cell IDs buttons are enabled.
4. For the report whose schedule you want to exclude, click the Select Schedules button.
Figure 58: Schedule List
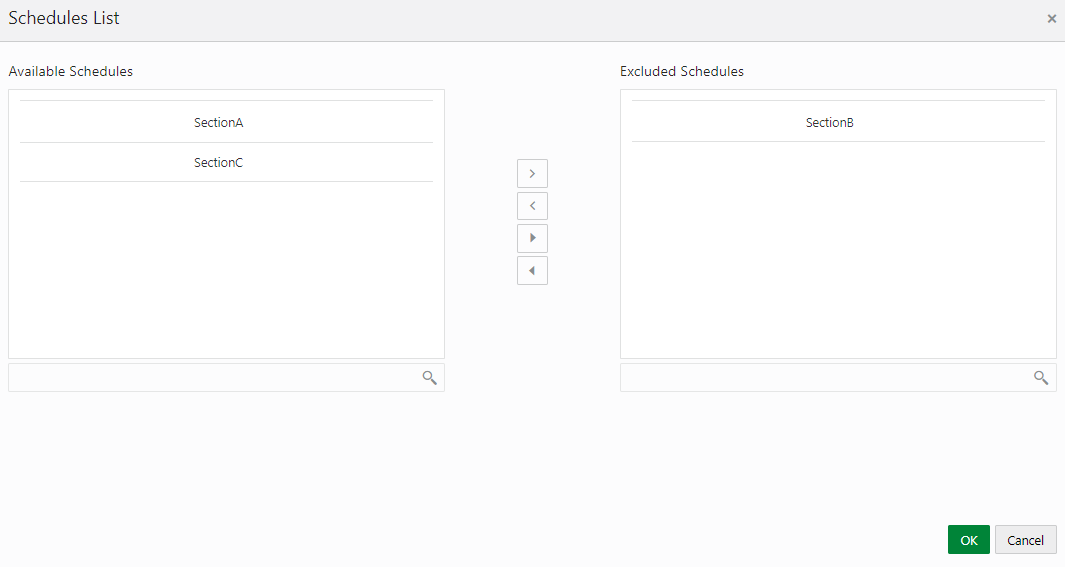
5. In the Schedules List window, in the Available
Schedules section, select the available schedules that you want
to exclude and then click the  icon.
icon.
NOTE:
The groupings appear based on your configuration.
The excluded schedules appear in the Excluded Schedules section.
6. Click OK.
7. Additionally, for the report whose cell ID you want to exclude, click the Select Cell IDs button.
Figure 59: Cell List
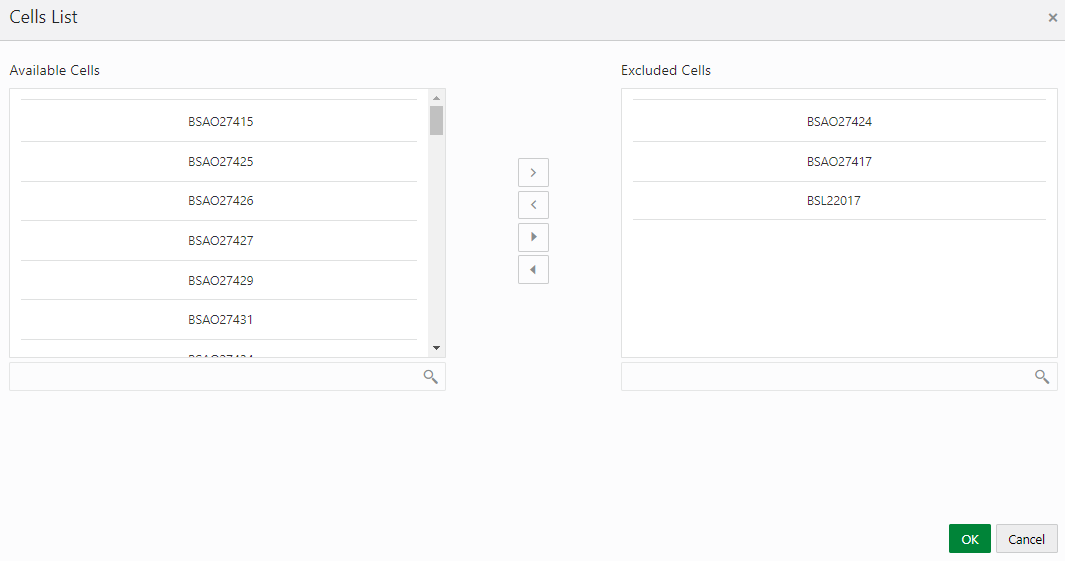
8. In the Cells List window, in the Available
Cells section, select the available cells that you want to exclude
and then click the  icon.
icon.
NOTE:
The groupings appear based on your configuration.
The excluded schedules appear in the Excluded Cells section.
9. Click OK.
10. To set the Alert Threshold Values at the Individual Report Level,
a. Select the report that you want to set the threshold for.
b. In the Threshold field, enter a value.
c. Click the Refresh Threshold button.
d. The threshold for all the cells associated with the report is updated with the new threshold value.
The maintenance has a list of seeded parameters that are dependent on the Data Quality Framework of OFSAAI. The outputs associated with these parameters are derived at the run time based on the Data Quality Profiling information within the Data Governance for APME Regulatory Reporting. The screen also enables a user to define new Assessment Parameters that can participate in the Score and Rating calculation of Assessment. The assessments for a particular control depend on the Parameter Type and Score Methodology.
All the users are required to be mapped to the DGSAUTHGRP, DGSADMINGRP, and DGSANALYSTGRP groups along with their respective following groups.
The following is the user role for control assessment parameters:
· DG Administration: Permits the user to view and edit the control assessment parameters.
To Control the Assessment Parameters, follow these steps:
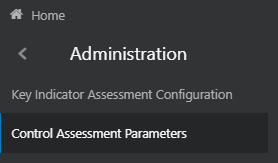
1. From Regulatory Reporting Data Sets and Governance for Asia Pacific and Middle East Jurisdictions window navigate to Administration and select Control Assessment Parameters.
Figure 60: Administration
The Control Assessment Parameters window is displayed.
Figure 61: Control Assessment Parameters
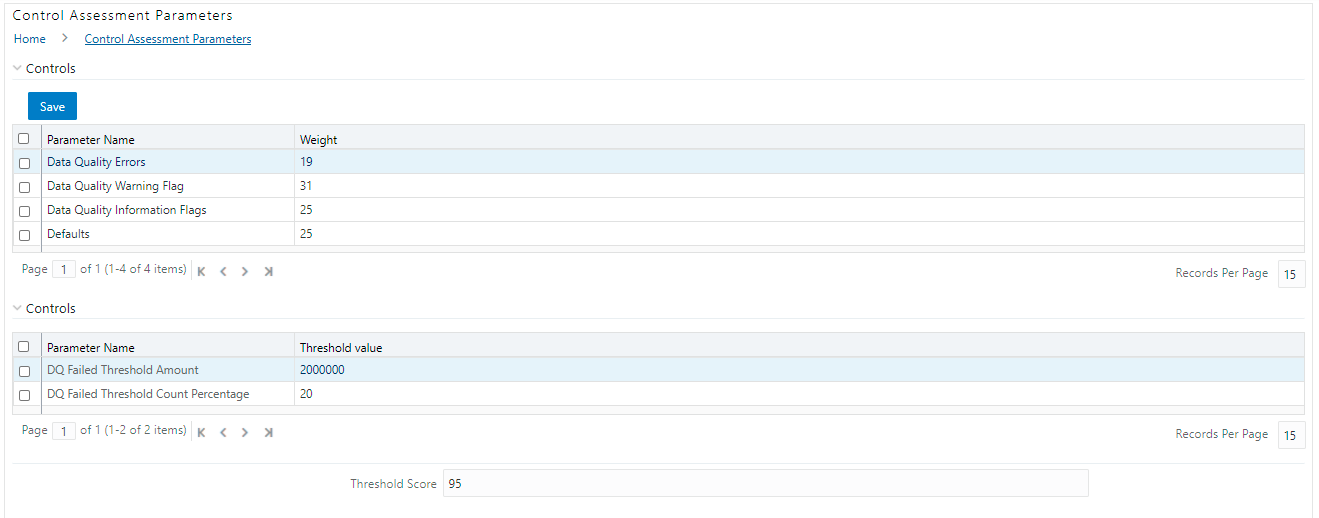
2. In the Controls section, to edit the Weight of the Parameters, run the Control Assessment Parameters.sql script in the atomic schema.
3. The weight is altered in the Control Assessment Parameters window.
Control is a measure taken to mitigate a regulatory reporting risk. Control measures help an organization to avoid risks that may otherwise hamper a business due to inconsistency in reporting. Controls are defined to ensure that the data elements used for various business processes are accurate in value and obtained in time.
The controls identified for risk mitigation can be recorded and stored in a repository. This section helps in capturing Controls, and also assesses their effectiveness in avoiding the risks of reporting.
Control effectiveness establishes the confidence factor in data elements and their values.
· Quality Controls: They are used to assess data accuracy.
Controls are defined on data elements based on the defined Data Quality rules. The effectiveness of these controls can be automatically assessed based on the Data Quality execution facts.
NOTE:
To view an issue and create an action, the user must be mapped to the following issue and action groups ACTNANLST, IAVWR, ISSUEADMN, ISSUEANLST in addition to other Control related groups.
The following are the types of Data Quality Checks and their definitions:
Data Quality Check |
Definition |
|---|---|
Blank Value Check |
Identifies if the base column is empty considering the blank space. |
Column Reference/Specific Value Check |
Compares the base column data with another column of the base table or with a specified direct value by using a list of pre-defined operators. |
Data Length Check |
Checks for the length of the base column data by using a minimum and maximum value, and identifies if it falls outside the specified range |
Duplicate Check |
Is used when a combination of the column is unique and identifies all duplicate data of a base table in terms of the columns selected for the duplicate check |
List of Value Check |
It can be used to verify values where a dimension/master table is not present. This check identifies if the base column data does not match with a value or specified code in a list of values. |
NULL Value Check |
Identifies if NULL is specified in the base column. |
Referential Integrity Check |
Identifies all the base column data that has not been referenced by the selected column of the referenced table. Here, the user specifies the reference table and columns. |
Range Check |
Identifies if the base column data falls outside a specified range of a Minimum and Maximum value. |
The controls are specific to reports. The Data Quality is defined in the DQ_CHECK_MASTER and DQ_GROUP_MAPPING tables.
NOTE:
The Data Quality rules are defined based on the Stage Table and Column mapped to a particular report.
All the users are required to be mapped to DGSAUTHGRP, DGSADMINGRP, and DGSANALYSTGRP groups along with their respective individual groups.
The following is the user role for control viewer:
· Control Viewer: Allows the user to view an issue and create an action.
Perform the following steps to create a Control through Batches:
1. For control creation, the FSI_DGS_CONFIGURATION table has to be seeded first.
NOTE:
In the N_LOOKUP_VALUE column, you can modify the values in the CREATOR and the OWNER fields.
Figure 62: Control Creation through Batches

2. Execute the batch DGS_DQ_CTL_BATCH, this batch contains the entire task that needs to be executed for control. See the APME (APRA/RBI/MAS) Run Chart.
Pre-Requisites
· For doing Control Assessment, the Control Execution Details must be present.
· Execution Details can be Data Quality or User Defined Parameters related.
· The Data Quality related parameters are available by default if Data Quality executions are done for that control.
Generate Assessments
Execute the batch DGS_CONTROL_BATCH, this batch has all the task which needs to be executed for control. Refer to the APME (APRA/RBI/MAS) Run Chart.
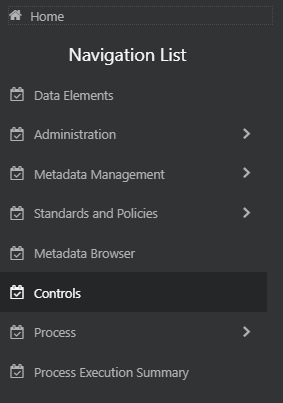
To view the controls, follow these steps:
1. From Regulatory Reporting Data Sets and Governance for Asia Pacific and Middle East Jurisdictions window navigate to Controls.
Figure 63: Controls
2. The Control summary window is displayed. After you execute the batch DGS_CONTROL_BATCH, the Control summary window displays the stage tables for which the controls are defined. It also displays the assessments and open issues if any.
Figure 64: Data Governance Controls
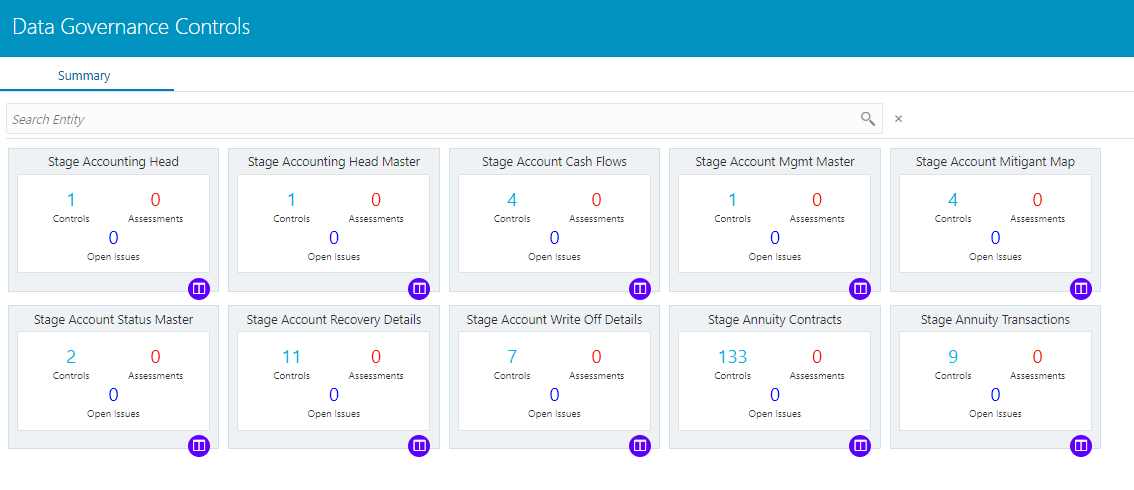
3. Select a stage
table and then click  View
Controls to view the details.
4. For example, the stage table Stage Investment and control Instrument Code in Stage Investments is selected here.
Figure 65: Data Governance Controls Stage investments
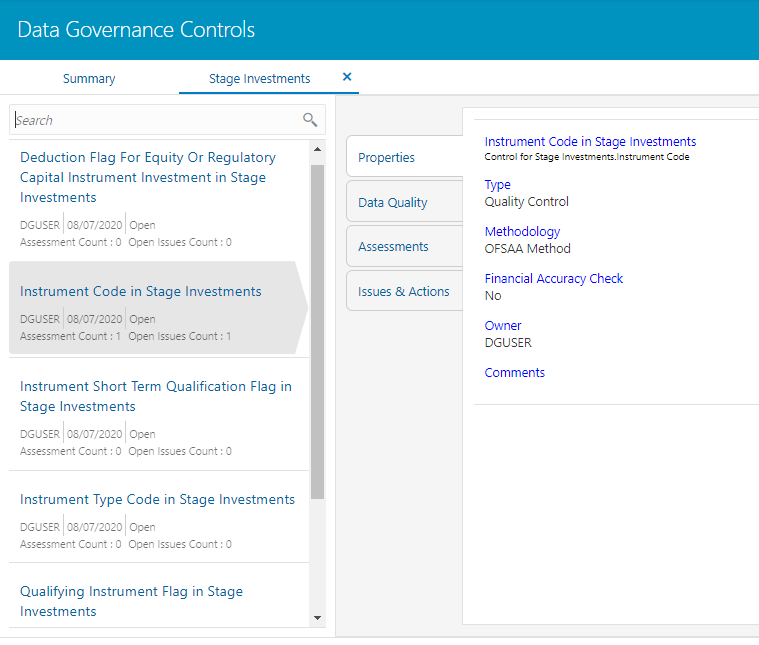
5. Click Properties, to view the control properties.
Figure 66: Data Governance Controls Properties
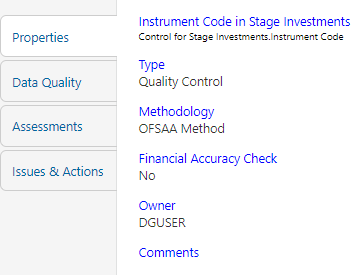
The Control Information is displayed:
— Name: Name of the control
— Type: Type of Control - Quality Control
— Methodology: Method used - OFSAA Method
— Financial Accuracy Check: Yes or No
— Owner: Name of the Owner
— Comments: Add comments if any
6. Click Data Quality, to view the Data Quality information on which the control is created.
Figure 67: Data Governance Controls Data Quality
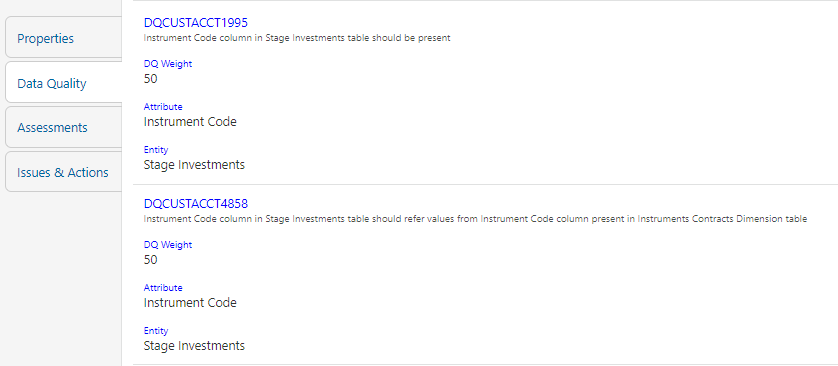
The Data Quality information is displayed:
— Data Quality Name: Name of the Data Quality contributing to the control.
— Data Quality Weight: Weight of the Data Quality contributing to the control. In case there is one Data Quality the number is 100. If there is more than one the number is divided to make it 100.
— Attribute: Name of the attribute on the entity column where the Data Quality is defined.
— Entity: Name of the stage table name.
7. Click Assessments, to view the Control Assessments.
Figure 68: Data Governance Controls Assessments
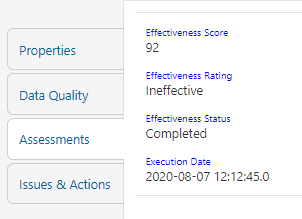
The Control Assessment information is displayed:
— Effectiveness Score: Control Assessment Score
— Effectiveness Rating: Control Assessment Rating. It can be Ineffective or Effective depending on the effectiveness score.
— Effectiveness Status: Control Assessment Status
— Execution Date: Assessment date and time
8. Click Issues & Actions to view the system-generated issues created for control.
Figure 69: Data Governance Controls Issues & Actions

To edit an issue, follow these steps:
1. From Regulatory Reporting Data Sets and Governance for Asia Pacific and Middle East Jurisdictions, window navigate to Controls.
2. Select a stage
table and then click  View
Controls to view the details.
3. Click Issues
& Actions.
The system-generated issues for this control are displayed.
Figure 70: Data Governance Controls Issues & Actions

4. Click the required issue to edit.
Figure 71: Data Governance Controls Issues & Actions
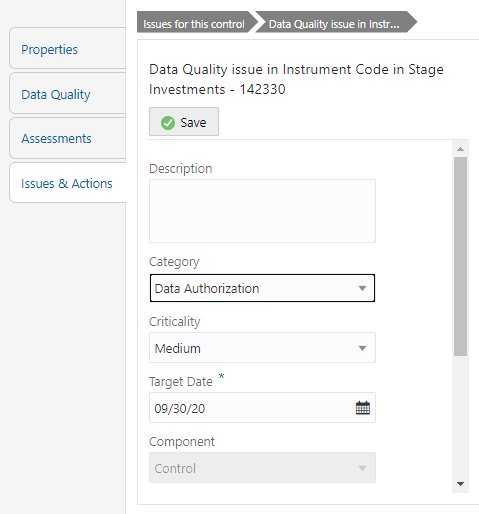
5. You are allowed to modify the following parameters or fields:
6. Description: Enter the description.
7. Category: Select the Category from the drop-down list.
8. Criticality: Select the criticality of the issue.
9. Target Date: Select the target date from the Date Calendar.
10. Component: Component module for which the issue is created.
11. Owner: Name of the Owner.
12. Status: Status of the Issue.
13. Comments: Add comments if any for the issue.
14. After editing the required fields, click Save.
The Issue Owner creates the required Actions for the system-generated Issue; also, the Issue Owner is the Data Adjustment Creator.
To create a new action for the system generated Issue, follow these steps:
1. From Regulatory Reporting Data Sets and Governance for Asia Pacific and Middle East Jurisdictions, window navigate to Controls.
2. Select a stage
table and then click  View
Controls to view the details.
3. Click Issues & Actions. The Issus for this control is displayed with the details.
Figure 72: Data Governance Controls Issues & Actions

4. Click the
required issue.
The Actions pane is displayed.
Figure 73: Data Governance Controls Actions
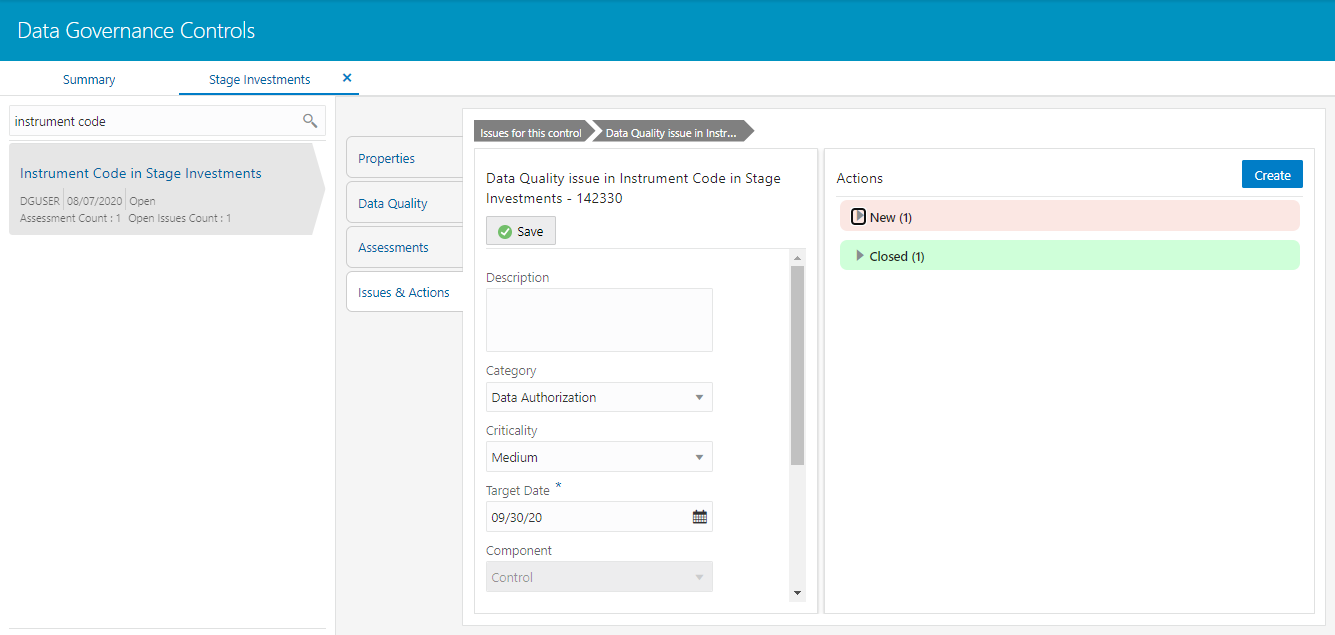
5. To create an action, in the Actions section click Create.
Figure 74: Data Governance Controls New Actions
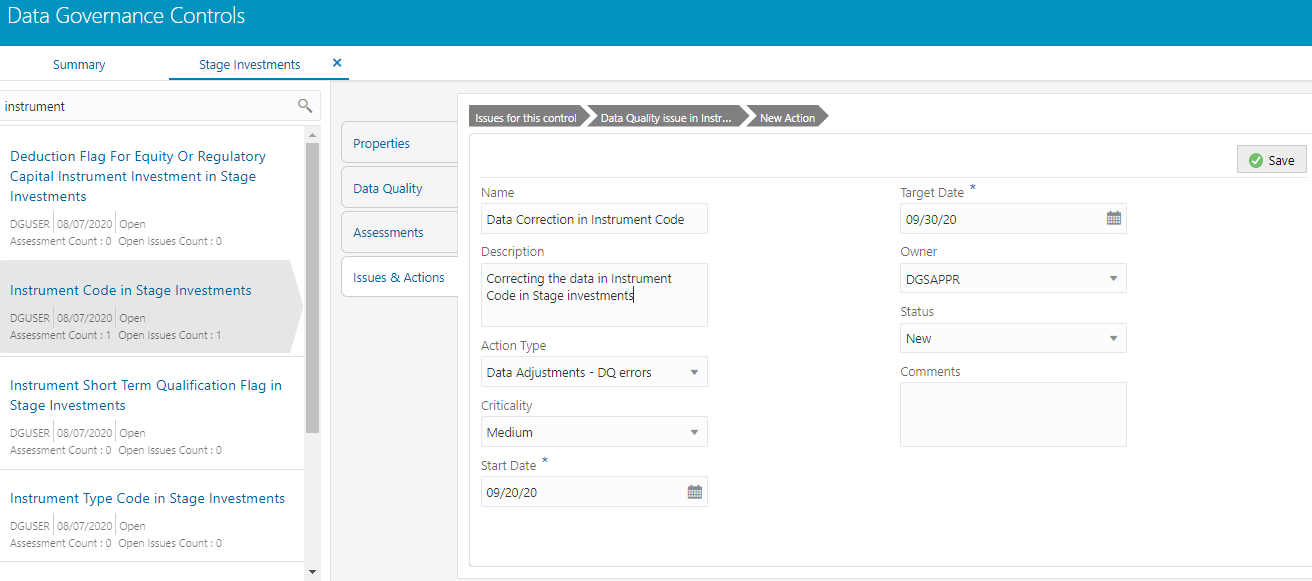
6. Enter the Name and Description.
7. Select the Action Type from the drop-down list:
— Data Adjustments - Data Quality errors
— Data Adjustments - Others
— Data Adjustments - Regulatory Reporting
— Reconciliation Adjustments
— Others
8. Select the Criticality:
— High
— Medium
— Low
9. Choose the
Start Date and Target Date from the Calendar  . Action
start and target date must be within the Issue target date.
10. Select the action Owner name from the drop-down list.
11. Select the Status from the drop-down list:
1 New
2 InProgress
3 Closed
12. Enter Comments if any and click Save. A confirmation message is displayed Action saved successfully. This creates an action for a particular issue.
NOTE:
Based on the Action Type, the Data Adjustment details page is displayed during the Data Adjustments process for Data Quality errors or any other errors.
13. When a new action is created it is listed under the Actions section under the New status of the Issue. In the Status field, the issue can be closed when it is resolved, it is then moved to Closed status.
Figure 75: Data Governance Controls New Actions
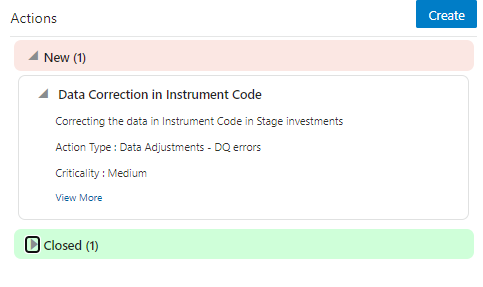
14. After an action is created, it is possible to create Data Adjustments.
Data Quality checks are grouped under the following types:
· Data Quality Errors - Percentage of records that have failed the data quality checks.
· Data Quality Warning Flag - Percentage of records that have passed but have a warning flag.
· Data Quality Information Flags - Percentage of records that are passed but have an information flag.
· Defaults - Percentage of records that are defaulted.
Configure the following three parameters in the DGS application to evaluate the Data Quality effectiveness:
· Threshold Score
· DQ Weight percentage
· Parameter Weight Percentage
Threshold Score
The threshold score is the value configured to compare with the computed Total Control Score to evaluate the effectiveness or ineffectiveness of the Data Quality control.
Sl No. |
Threshold Configuration |
Weight |
|---|---|---|
1 |
Threshold Score |
50 |
DQ Weight Percentage
This value is configured based on the number of data quality checks mapped to a data quality control. For example, if there are four data quality checks mapped, then the data quality weight percentage is as displayed as follows:
Sl No. |
Control ID |
Data Quality ID |
Weight |
|---|---|---|---|
1 |
865675 |
E1_STC_STLMT_DAT_01 |
25% |
E1_STC_STLMT_DAT_02 |
25% |
||
E1_STC_STLMT_DAT_03 |
25% |
||
E1_STC_STLMT_DAT_04 |
25% |
Parameter Weight Percentage
Data quality checks are tagged as Error/Warning/Information/Default and each of these is given a weight age. The values are configurable from the DGS application.
Sl No. |
Data Quality Type |
Weight |
|---|---|---|
1 |
Data Quality Errors |
20 |
2 |
Data Quality Warning Flag |
30 |
3 |
Data Quality Information Flags |
25 |
4 |
Defaults |
25 |
Step 1.
Compute the DQ Failure Percentage for every single Data Quality in each Data Quality Type
DQ Failure - DQ1 Error = (Failed Record Count/Total Scan Record)*100
DQ Failure - DQ1 Warning = (Failed Record Count/Total Scan Record)*100
DQ Failure - DQ1 Information = (Failed Record Count/Total Scan Record)*100
DQ Failure - DQ1 Default = (Failed Record Count/Total Scan Record)*100
Step 2.
Compute the Cumulative Control Score
Control Score is the sum of DQ Failure * Parameter Weight for a DQ for each of the DQ Type multiplied into DQ Weight Parameter, likewise, compute for each DQ mapped to a DQ control. For Cumulative Control, Score adds Control Score for each DQ in a DQ control and then divides by 100.
Cumulative Control Score =
[[DQ1 Error * Parameter Weight] + [DQ1 Warning * Parameter Weight] +
[DQ1 Info * Parameter Weight] + [DQ1 Defaults * Parameter Weight] *
DQ1 weight] +
[[DQn Error * Parameter Weight] + [DQn Warning * Parameter Weight] +
[DQn Info * Parameter Weight] + [DQn Defaults * Parameter Weight] *
DQn weight]] / 100
Step 3.
For each Data Quality control, the Total Control Score is computed as:
Total Control Score = 100 minus (Cumulative Control Score)
If the Total Control Score is equal to or above the Threshold Score, then the control is effective, and if below the Threshold Score it is Ineffective.
Data Quality Control Evaluation with GL Recon Validation
In case GL Recon Application is installed and measure data quality checks have financial validation check set as Y then effective or ineffective evaluation is as follows:
Sl No. |
Data Quality Control Validation |
Status |
|---|---|---|
1 |
IF GL Recon is installed, all reconciliations are passed, and the Total Control score is equal to or above the configured threshold |
Control Effective |
2 |
IF GL Recon is installed, any reconciliations fail, and the Total Control score is above the configured threshold. |
Control Ineffective |
3 |
IF GL Recon is installed, all reconciliations are passed, and the Total Control score is below the configured threshold. |
Control Ineffective |
4 |
IF GL Recon is installed, any reconciliations fail, and the Total Control score is below the configured threshold. |
Control Ineffective |
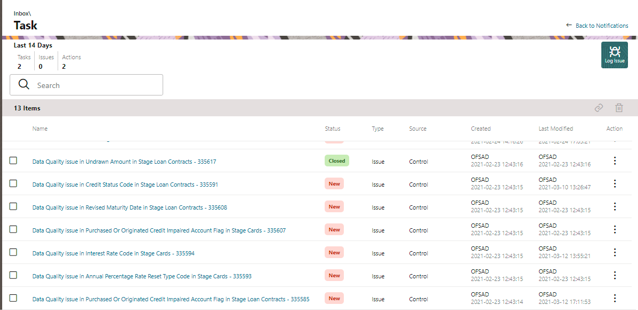
It is possible to log an issue and view the tasks, issues, and actions created in the application under the Inbox menu. Inbox displays the summary of issues and actions performed over the last 14 days.
To log an issue or view or create tasks, issues, and actions, perform the following steps:
1. From Regulatory Reporting Data Sets and Governance for Asia Pacific and Middle East Jurisdictions and then click Go To Tasks.
Figure 76: Inbox
The Inbox Summary window is displayed with the list of tasks, issues, and actions.
Figure 77: Inbox Summary
2. Click  icon
to log an issue. The create window is displayed.
Figure 78: Create Issue
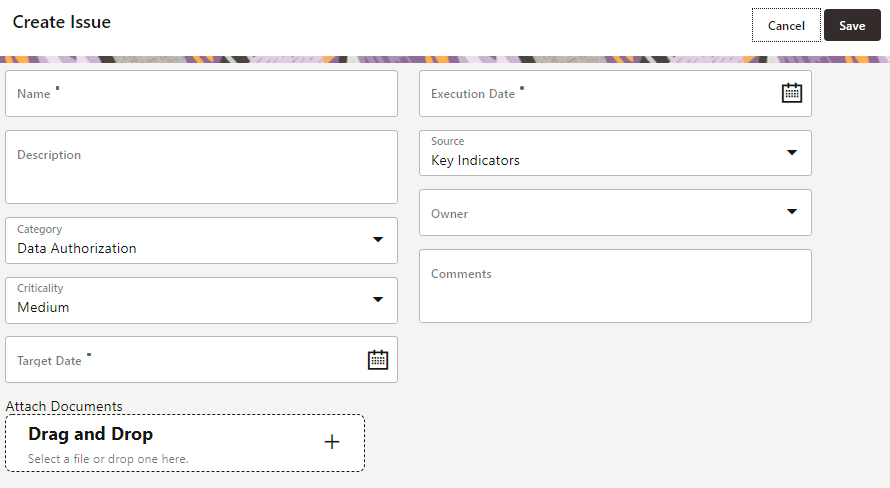
3. Enter Issue Name and Description.
4. Select the Category from the drop-down list:
§ Data Authorization
§ Data Privacy
§ Data Security
§ Data Accuracy
§ Data Availability
§ Timeliness
5. Select the Criticality:
§ High
§ Medium
§ Low
6. Choose the
Target Date from the Calendar  .
.
7. Choose the
Execution Date from the Calendar  .
.
8. Select the Source from the drop-down list:
§ Key Indicators
§ Controls
9. Select the Owner from the drop-down list.
10. Enter Comments if any.
11. Select a file or drag and drop a file to Attach a document.
12. Click Save.
A new issue is created and is displayed under the inbox summary screen.
13. Click an existing issue.
14. The following window is displayed.
Figure 79: Issues
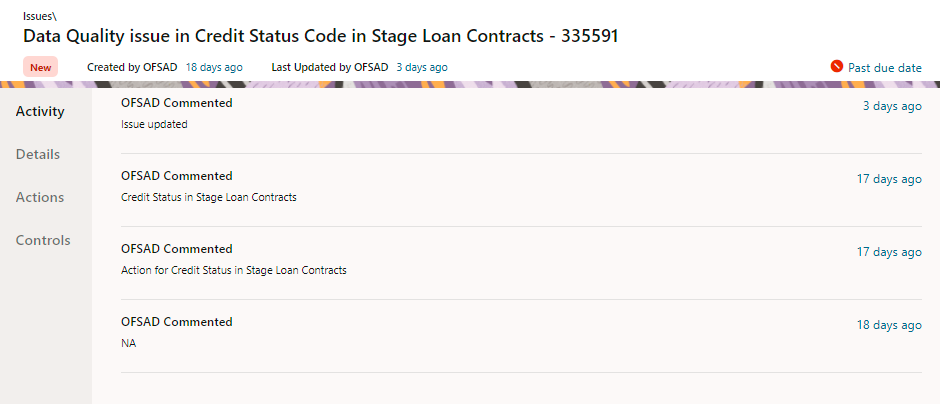
15. Click Activity. Any comment that gets logged for an issue is displayed here.
16. Click Details. See section Editing an Issue for information.
17. Click Actions. See section Creating an Action for information.
18. Click Controls. You can create an action for an existing issue.
19. Select an
issue and click  .
.
The Control window is displayed with the control
details that can be linked to the issue.
Figure 80: Controls
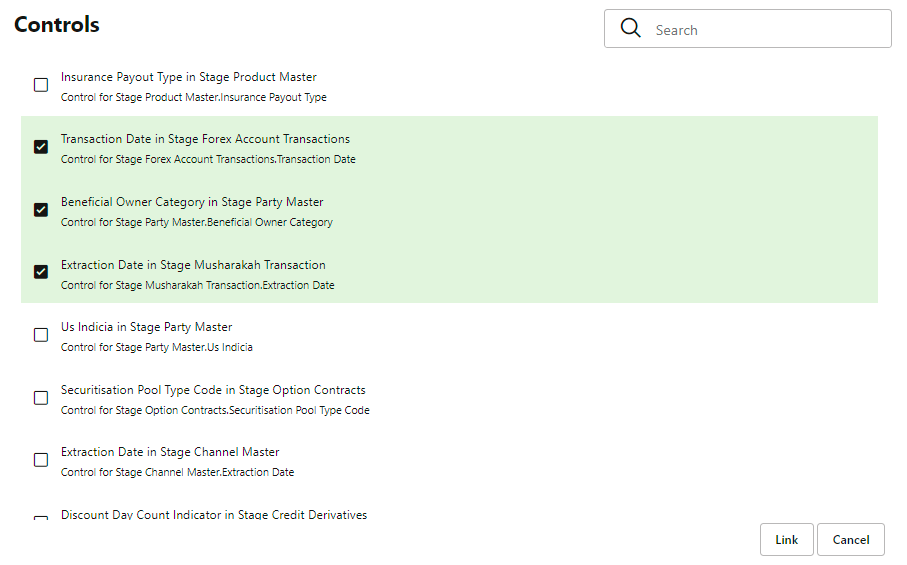
20. Select the controls and click Link. At any point in time, you can search for control in the search field.
21. Select an
issue or an action and click  .
A confirmation message is displayed. Click Yes to delete or click No to
cancel the deletion.
22. Note that, it is possible to delete an issue or an action that is in status New and it is not possible to delete a closed issue or an action.
23. Click  against the required issue or
an action to perform one of the following.
Figure 81: Task
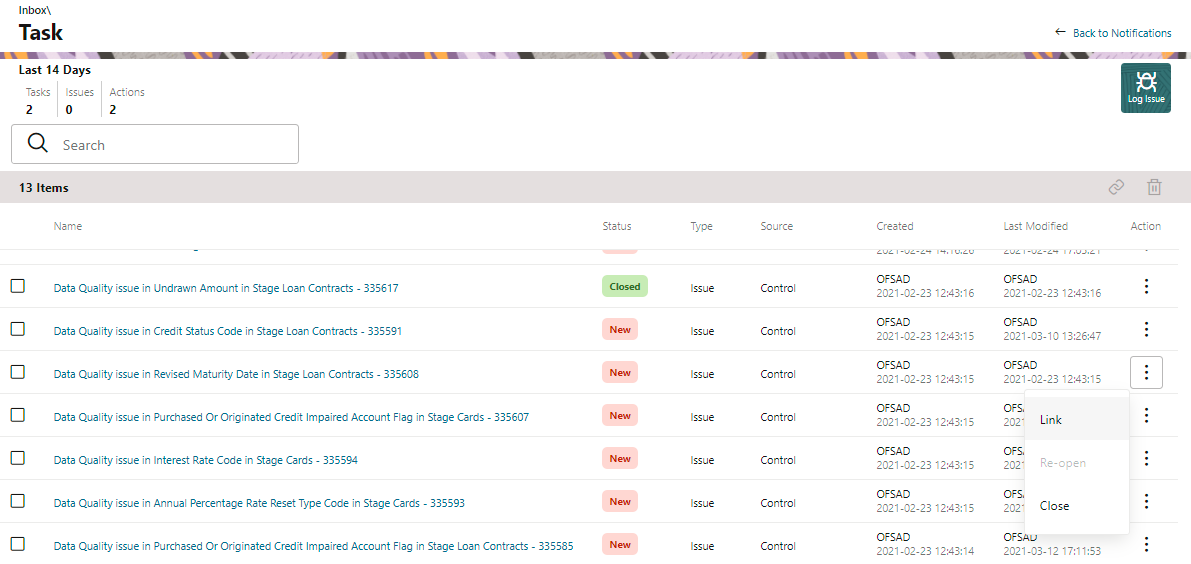
24. If an Issue is in:
§ New State, you can link or close an issue.
§ Closed State, you can re-open an issue.
§ Re-open State, you can close the issue.
25. If an Action is in:
§ New State, you can close an action.
§ Closed State, you can re-open an action.
§ Re-open State, you can close the action.
The Adjustment framework is a capability that is used to modify, as per business requirements, or correct issues, that have been found by various OFSAA components, in available data within FSDF. The adjustments are created when an issue and action are created. In turn, they are then used to track and report any operation that is performed on the data. All adjustments that are created must be executed through a batch.
The Data Adjustment process can be visualized through the following diagram:
For an Adjustment Creator
Figure 82: Data Adjustment Process
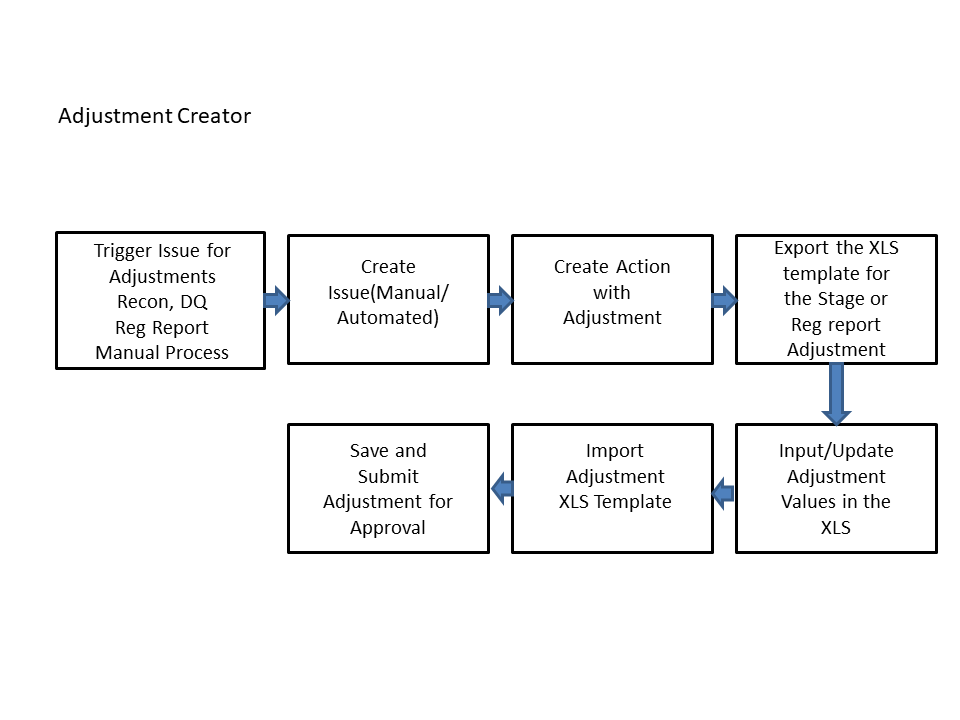
1. The issue is triggered for adjustments.
2. An issue is created.
3. An action is created with the adjustment.
4. The adjustment is configured and the template for the stage or the regulatory reporting template is exported.
5. The Excel template is updated with the required inputs.
6. The adjustment is then imported.
7. The adjustment is saved and submitted for approval to the Data Adjustment Approver.
For an Adjustment Approver:
Figure 83: Data Adjustment Process
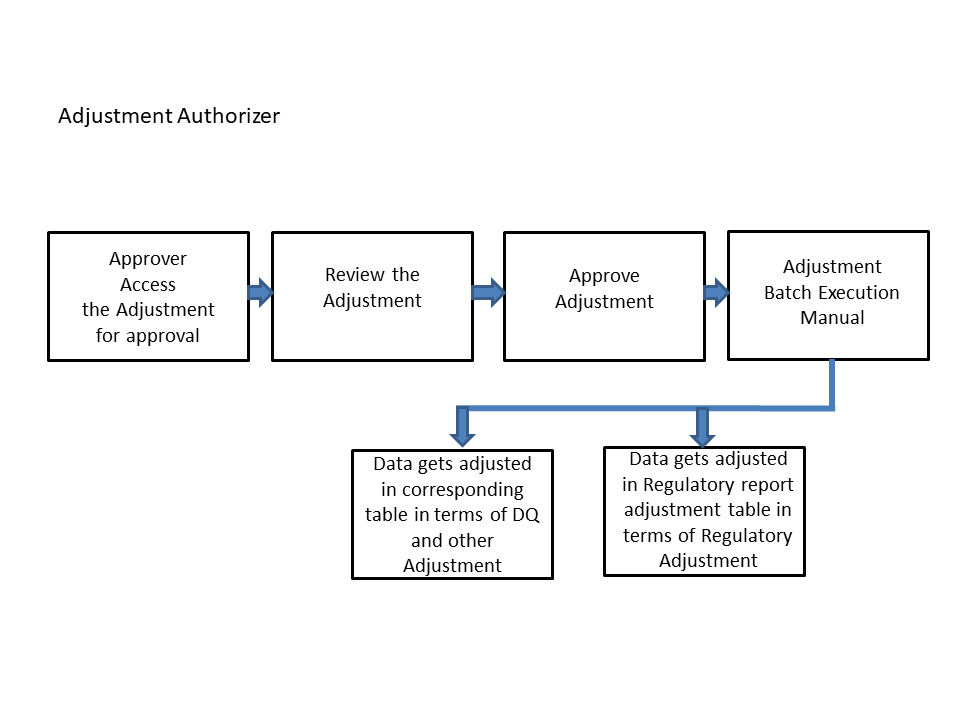
1. The data adjustment Approver accesses the saved adjustment.
2. The data adjustment is reviewed.
3. The data adjustment is approved.
4. The batch is executed manually for the data adjustment.
5. If the data adjustment type is regulatory reporting, then the data is adjusted in the regulatory report adjustment table as per the data present in the regulatory reporting data adjustment.
Or
6. In the case of other data adjustment types, the data is adjusted in the corresponding tables as per the data in the data adjustment.
Types of Data Adjustments
You can create an issue for various reasons; lack of data accuracy, unavailable data, etc. Issues for these scenarios can be created for Controls or Key Indicators. After the issue has been created, appropriate actions must be created with the associated adjustment rules to resolve problems in the data. The adjustment process does not modify the data received from the source system; instead, it creates a new version of the record that is based on the load run ID. This ensures that FSDF always contains the original and all adjusted copies of the data for auditing and record-keeping. The supported action types are:
· Data Adjustments - Data Quality Errors
When a predefined Data Quality rule associated with a field in which control has breached the threshold occurs, a system-generated issue is created to highlight the data quality failure.
Reconciliation Adjustments
The adjustments to resolve reconciliation failures can be set in a system that contains the DG and Reconciliation framework within the same infodom. When a predefined Reconciliation rule fails, a system-generated issue is created. After the issue is updated, you can create an action.
Data Adjustment - Others
These adjustments are set for known data issues for a set period than for scheduled executions or checks. An example of this scenario: a legacy source system that is unable to perform a transformation required by OFSAA due to cost or any other reasons. It is easier to adjust the data within OFSAA rather than in the source system.
· Data Adjustments - Regulatory Reporting
You can set the adjustments to perform at the level of a reporting attribute than within the staging area. This adjustment enables you to create last-mile data corrections at the MDRM level.
Others
This is used for any other online or offline action that is to be performed to resolve a specific issue. These actions are created to maintain and track all efforts made to resolve an issue. They enable you to follow an issue to its closure, for reporting purposes, etc. This action type has no impact on adjustments.
NOTE:
These adjustments are only available for existing customer accounts or MDRM codes.
The basic roles and the groups defined in the OFS APME application for Data Adjustment are:
User Role |
Group Code |
Group Description |
Role Code |
|---|---|---|---|
Creator |
ADJCREATGRP |
Adjustment Create |
ADJCREATOR |
ADJGRPCREATOR |
Adjustment Grp Creator |
ADJGRPCREA |
|
Approver |
ADJAPPGRP |
Adjustment Approver |
ADJAPPROVE |
ADJGRPAPPROVER |
Adjustment grp appr Group |
ADJGRPAPPR |
The actions that can be executed by specific user roles in the OFS APME application for Data Adjustment are:
Action Performed |
User Role |
|---|---|
In the automated process, an Issue is generated by the system. |
Assigned to the Issue Owner. |
Creating Action for the system-generated Issue. |
By the Issue Owner. |
Creating Data Adjustment. |
By the Action Owner. |
Submitting Data Adjustment. |
By the Action Owner (must contain the Adjustment creator role). |
Data Adjustment Approval. |
By the Issue Owner (must contain the Adjustment approver role). |
NOTE:
You must follow the sequence of steps described in the following sections.
The Issue Owner (Action Creator) may change ownership when required. The Issue Owner creates an Action of type Data Adjustment for this system generated Issue and assigns it to the Action Owner. As a result, in Actions, the Data Adjustment grid appears. The Action Owner (Adjustment Creator) then creates the required Data Adjustment and makes data corrections for the failed Data Quality.
The Adjustment Creator submits Data Adjustment to the Adjustment Approver (Issue Owner). After the Issue Owner approves all the Data Adjustment definitions, the Data Adjustments are grouped in a Batch and executed at the level of that Issue. After the successful execution of these Data Adjustments, the Action Owners must mark the Action progress to 100% or mark the Action as completed.
NOTE:
For Regulatory Reporting before creating a Regulatory Reporting Data Adjustment, you can execute a KI assessment.
· Set the N_lookup_value =Y against v_lookup_code= PRE_POST_ADJ_AUDIT_LOG in the table fsi_dgs_configuration. This enables the Show Data button in the Issue screen, where you can view the pre- and post-adjustment data.
· An Action must be created for the system-generated Issues.
The Action Owner is the Data Adjustment Creator. The Actions are of type Data Adjustment. Therefore, the Data Adjustment grid appears in this section.
NOTE:
If you have selected the Action Type as Others, then the Adjustments section does not appear.
To create a Data Adjustment, follow these steps:
1. Log in to the application as the Action Owner (Data Adjustment Creator).
2. From Regulatory Reporting Data Sets and Governance for Asia Pacific and Middle East Jurisdictions window navigate to Controls.
3. Select a stage
table and then click  View
Controls to view the details.
4. Click Issues & Actions.
5. In the Issues for this control, click the required system-generated
Issue ID.
The Actions section is displayed.
Figure 84: Issues & Actions

6. In the Actions,
select the required issue to View More details.
The Data Adjustments section is displayed.
Figure 85: Issues & Actions
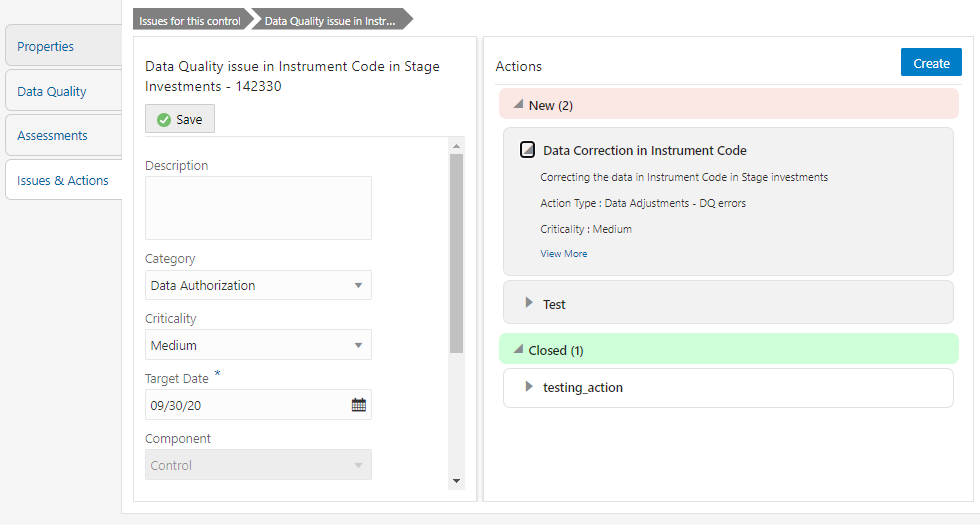
7. In the Data Adjustments section, click Create.
The Adjustment Rule Details window is displayed.
Figure 86: Issues & Actions
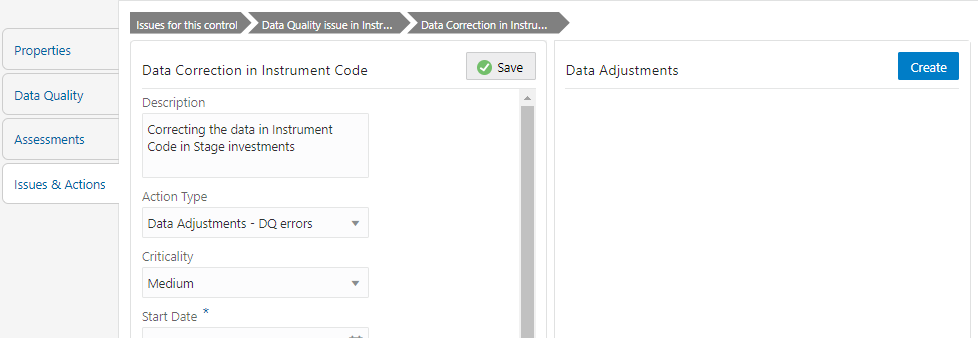
8. Depending on the type of adjustment, create a data adjustment.
To create a data adjustment for the action type Data Adjustments - Data Quality Errors, follow these steps:
1. From the Issues & Actions page, under an action created, click View More.
2. On the Data
Adjustment page, click Create.
The Adjustments Rule Details window is displayed.
3. In the Adjustment Rule Details window, enter values in the Name and Description fields.
Figure 87: Issues & Actions
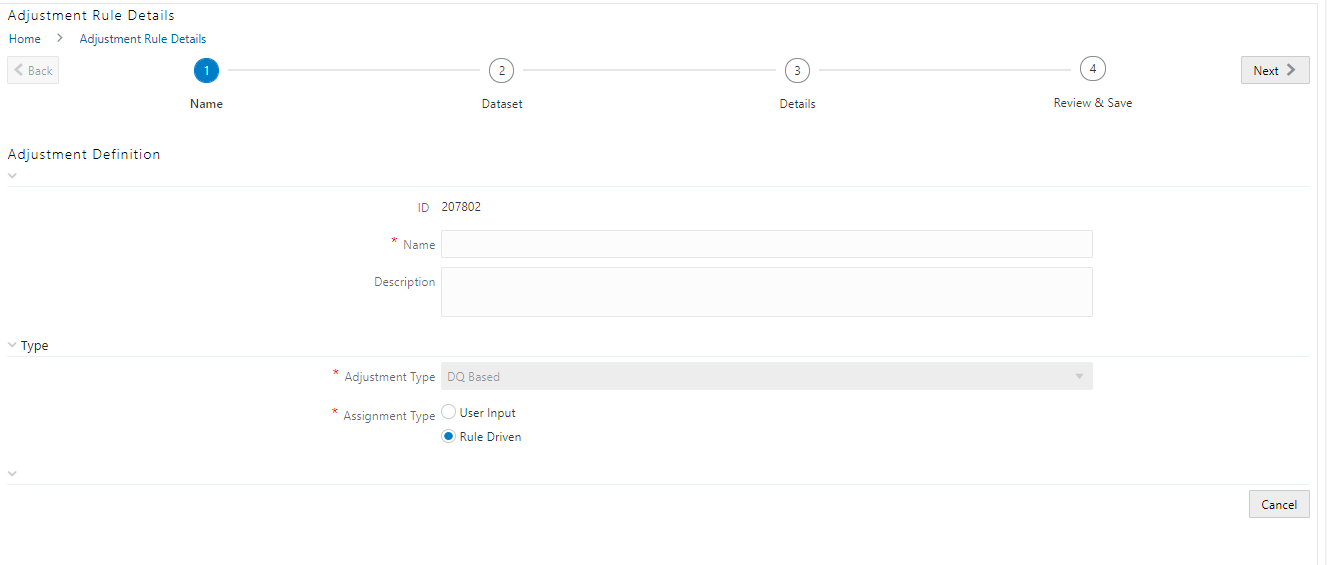
4. Select the Assignment Type as either User Input or Rule Driven.
5. For User Input:
a. In the Adjustment Entity drop-down, select a value.
b. In the Select Filter section, enter values in the following fields:
Field |
Description |
|---|---|
Filter Type |
Select a value from the drop-down box. |
Filter Attribute |
Select a value from the drop-down box. |
Hierarchy Name |
Select a value from the drop-down box. |
Hierarchy Values |
Select a value from the drop-down box. |
Hierarchy |
Select a value from the drop-down box. |
c. Click Next.
d. Select Add Expression.
e. In the Add Expression window, in the Line Item, Business Processor drop-downs, select the required values.
f. In the Expression field, enter the expression, and then select OK.
g. Click Next, and then click Save.
h. In the Manual Data section, select Export.
i. In the Export window, in the MIS Date section, select a date for which the data is available, and then click Export.
j. Save the Excel file to your system.
k. Enter values in the required rows and then save the Excel.
l. In the Manual Data section, in the ID column, select the required ID and then click Import.
m. In the Import window, attach the Excel that you added data to, and then click Upload.
n. Click Import.
o. Click Submit if you want to send the Data Adjustment for approval or click Save.
6. For Rule Driven:
a. To go to the next section, click Next or click Dataset.
b. In the Select Data Quality dropdown box, select the required
Data Quality value.
This Data Adjustment is being created for this failed Data Quality.
c. Click Next.
d. Click Add Expression.
e. In the Add Expression window, enter values in the following fields:
Field |
Description |
|---|---|
String |
Select a value from the drop-down box. |
Date and Time |
Select a value from the drop-down box. |
Aggregate |
Select a value from the drop-down box. |
Others |
Select a value from the drop-down box. |
Mathematical |
Select a value from the drop-down box. |
Concatenation |
Select a value from the drop-down box. |
Mathematical operators |
Select a value from the drop-down box. |
Others |
Select a value from the drop-down box. |
Comparison |
Select a value from the drop-down box. |
Logical Operators |
Select a value from the drop-down box. |
Expression |
Enter an expression. |
f. Click OK.
g. Click Next.
h. In the Review and Save section, click Save.
The Data Adjustment for the action has been created.
To create a data adjustment for the action type Data Adjustments - Others, perform the following steps:
1. From the Issues & Actions page, under an action created, click View More.
2. On the Data Adjustment page, click Create. The Adjustments Rule Details window is displayed.
3. In the Adjustment Rule Details window, enter values in the Name and Description fields.
Figure 88: Adjustment Rule Details

4. Select the Assignment Type as either User Input or Rule Driven.
5. For User Input:
a. In the Adjustment Entity drop-down, select the entity or table for which the adjustment must be performed.
b. In the Select Filter section, enter values in the following fields:
Field |
Description |
|---|---|
Filter Type |
Select a value from the drop-down box. |
Filter Attribute |
Select a value from the drop-down box. |
Hierarchy Name |
Select a value from the drop-down box. |
Hierarchy Values |
Select a value from the drop-down box. |
Hierarchy |
Select a value from the drop-down box. |
c. Click Next.
d. Select Add Attribute.
e. In the Add Column window, in the Target Attribute drop-down, select a value and then click OK. The target attribute displays the columns based on the selected entity.
f. Click Next, and then click Save.
g. In the Manual Data section, select Export.
h. In the Export window, in the MIS Date section, select a date the entity has data, and then click Export.
i. Save the Excel file to your system.
j. Enter values in the specific columns as per the selected target attribute, and then save the Excel.
k. In the Manual Data section, in the ID column, select the required ID and then click Import.
l. In the Import window, attach the Excel that you added data to, and then click Upload.
m. Click Import.
n. Click Submit if you want to send the Data Adjustment for approval or click Save.
6. For Rule Driven:
a. To go to the next section, click Next or click Dataset.
b. In the Adjustment Entity, Filter Type, Filter Attribute, Hierarchy Name, and Hierarchy drop-down boxes, select a value.
c. Click Next.
d. Click Add Expression.
e. In the Add Expression window, enter values in the following fields:
Field |
Description |
|---|---|
Column |
Select a value from the drop-down box. |
String |
Select a value from the drop-down box. |
Date and Time |
Select a value from the drop-down box. |
Aggregate |
Select a value from the drop-down box. |
Others |
Select a value from the drop-down box. |
Mathematical |
Select a value from the drop-down box. |
Concatenation |
Select a value from the drop-down box. |
Mathematical operators |
Select a value from the drop-down box. |
Others |
Select a value from the drop-down box. |
Comparison |
Select a value from the drop-down box. |
Logical Operators |
Select a value from the drop-down box. |
Expression |
Enter an expression. |
f. Click OK.
g. Click Next.
h. In the Review and Save section, click Save.
The Data Adjustment for the action has been created.
To create a data adjustment for the action type Data Adjustments - Regulatory Reporting, perform the following steps:
NOTE:
You can create a data adjustment for a regulatory reporting-based adjustment, only if the actions are in a new status.
1. From the Issues & Actions page, under an action created, click View More.
2. In the Data Adjustment page, click Create. The Adjustments Rule Details window is displayed.
3. In the Adjustment Rule Details window, enter values in the Name and Description fields.
Figure 89: Adjustment Rule Details

4. Select the Assignment Type as either User Input or Rule Driven.
5. For User Input:
a. In the Select Report section, in the Report and Schedule drop-downs, select the required report and schedule.
b. Click Next.
c. In the Data Update section, select Add Line Item.
d. In the Add Line Item window, in the Line Item drop-down, select a value, and then click OK.
e. Click Next, and then click Save.
f. In the Manual Data section, select Export.
g. In the Export window, in the MIS Date section, select the date for which the assessment has been performed, and then click Export.
h. Save the Excel file to your system.
i. Enter the adjustment amount in the column N_ADJUSTED_AMT, and then save the Excel.
j. In the Manual Data section, in the Id column, select the required ID and then click Import.
k. In the Import window, attach the Excel that you added data to, and then click Upload.
l. Click Import.
m. Click Submit if you want to send the Data Adjustment for approval or click Save.
6. For Rule Driven:
a. To go to the next section, click Next or click Dataset.
b. In the Adjustment Entity, Report, Schedule, and Dataset drop-down boxes select a value.
c. Click Next.
d. Click Add Expression.
e. In the Add Expression window, enter values in the following fields:
Field |
Description |
|---|---|
Line Item |
Select a value from the drop-down box. |
Expression Type |
Select either Business Processor or Build Expression. |
Build Processor |
Select a value from the drop-down box. This field is only available if you selected the Expression type as Build Expression. |
Measure |
Select a value from the drop-down box. This field is only available if you selected the Expression type as Business Processor. |
Business Processor |
Select a value from the drop-down box. This field is only available if you selected the Expression type as Business Processor. |
Aggregate |
Select a value from the drop-down box. This field is only available if you selected the Expression type as Business Processor. |
Comparison |
Select a value from the drop-down box. This field is only available if you selected the Expression type as Business Processor. |
Logical Operators |
Select a value from the drop-down box. This field is only available if you selected the Expression type as Business Processor. |
Others |
Select a value from the drop-down box. This field is only available if you selected the Expression type as Business Processor. |
Date and Time |
Select a value from the drop-down box. This field is only available if you selected the Expression type as Business Processor. |
Mathematical |
Select a value from the drop-down box. This field is only available if you selected the Expression type as Business Processor. |
Others |
Select a value from the drop-down box. This field is only available if you selected the Expression type as Business Processor. |
String |
Select a value from the drop-down box. This field is only available if you selected the Expression type as Business Processor. |
Mathematical operators |
Select a value from the drop-down box. This field is only available if you selected the Expression type as Business Processor. |
Concatenation |
Select a value from the drop-down box. This field is only available if you selected the Expression type as Business Processor. |
Expression |
Enter an expression. |
7. Click OK.
8. Click Next.
9. In the Review and Save section, click Save. The Data Adjustment for the action is created.
NOTE:
These steps are only applicable if your adjustment is of the User Input type.
In the Review & Save tab, Exporting User Input Type Data Adjustment:
1. To export (download from the application) a record from the User Input type Data Adjustment, click Export.
2. In the Export window, select the MIS Date for which you are downloading the record to make the data corrections.
3. Click Export, and then close the Export
window.
An excel file is downloaded to your system.
4. In the downloaded (exported) excel file, you can make the required data corrections.
5. Save the changes made to the file.
In the Review & Save tab, Importing User Input Type Data Adjustment:
1. To import (upload to the application) the updated excel file for the User Input type Data Adjustment, select the Manual Data ID of the required record, and then click Import.
2. To search for the updated, excel file, open and attach it, click Attach.
3. To upload
this, excel file, click Upload.
After a successful upload, an acknowledgment message is displayed.
4. To import the uploaded Excel file into the application, click Import.
NOTE:
After you successfully import a file, its status appears as Imported.
1. To save this Data Adjustment record, select the checkbox against the imported record, and then click Save. A confirmation message is displayed, confirming that the adjustment details were successfully saved.
2. Click OK.
3. To submit
this Data Adjustment for approval to the Adjustment Approver, click Submit.
A confirmation message is displayed, confirming that the adjustment details
are saved successfully.
4. Click OK. The Adjustment Rules Details page automatically closes.
5. For user input, to send the imported file for approval to the Approver, you must select the checkbox against the record and then click Save.
6. In the View Adjustment Details page, click Refresh. The newly created Data Adjustment is in the Pending Approval state.
7. After you click Save, if do not submit the Data Adjustment for approval, the Status of the Data Adjustment is in the Draft state. To move the Status from Draft to Pending Approval, open the Data Adjustment, and click Submit.
To view the pre and post adjusted data, follow these steps:
1. From Regulatory Reporting Data Sets and Governance for Asia Pacific and Middle East Jurisdictions window navigate to Controls.
2. Select a stage
table and then click  View
Controls to view the details.
3. Click Issues
& Actions.
The Issues Summary window is displayed.
Figure 90: Issue Summary

4. Click View
Adjustment Details.
The Data Adjustment Summary window is displayed. In the Actions
window, the action that was created for the issue is displayed.
Figure 91: Data Adjustment Summary
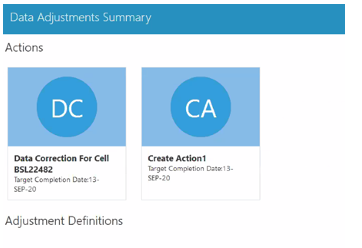
5. Click the
required Action.
The adjustments that are defined for the actions are displayed.
6. Click the required adjustment. The pre and post-adjusted data is displayed.
Figure 92: Adjustment Details
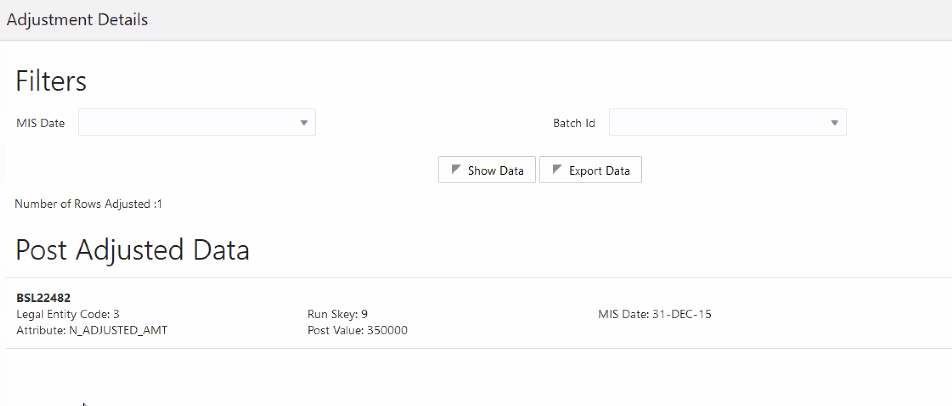
NOTE:
For the Data Adjustment - Regulatory Reporting, only the adjusted data appears.
To view, and approve or reject the Data Adjustment, perform the following steps:
1. Log in to the application as the Action Owner (Data Adjustment Creator).
2. From Regulatory Reporting Data Sets and Governance for Asia Pacific and Middle East Jurisdictions window, navigate to Controls.
3. Select a stage
table and then click  View
Controls to view the details.
4. Click Issues & Actions.
5. In the Issues for this control, click the required system-generated
Issue ID.
The Actions section is displayed.
6. In the Actions section, in the ID column, click the required Action ID.
7. In the Action Details page In the Adjustments section, select the required Data Adjustment which is in the Pending Approval state.
8. To open this Data Adjustment details, click View.
9. In the Adjustment Rule Details window, click the Review & Save tab.
10. Select the Manual Data Id, and then click Download.
The data correction records file uploaded to the system, by the Data Adjustment Creator, is downloaded to your system.
11. Verify the data records and in the Comments field, type the required comments.
12. To approve the Data Adjustment, in the Comment field, enter a comment, and click Approve.
The Adjustment Rule Details window automatically closes.
13. In the Action Details page, in the Adjustments section, click Refresh. The status of the Data Adjustment is changed to the Approved state. In the account of Data Adjustment Creator, the state of this Data Adjustment is updated to the Approved state.
Or
To reject the Data Adjustment, in the Comment field, enter a comment and click Reject. The Adjustment Rule Details window automatically closes.
14. In the Action Details page, in the Adjustments section, click Refresh.
For a rejected Data Adjustment, the state is changed to Draft.
If the Data Adjustment is rejected perform the following steps:
1. Log in to the application as the Action Owner (Data Adjustment Creator).
2. From Regulatory Reporting Data Sets and Governance for Asia Pacific and Middle East Jurisdictions window navigate to Controls.
3. Select a stage
table and then click  View
Controls to view the details.
4. Click Issues & Actions.
5. In the Issues for this control, click the required system-generated
Issue ID.
The Actions section is displayed.
6. In the Actions section, in the ID column, click the required Action ID.
7. In the Adjustment Rule Details page, in the Review & Save tab, make the required changes.
8. To save this
Data Adjustment record, click Save.
A confirmation message appears, confirming that the adjustment details
are saved successfully.
9. Click OK.
10. To re-submit this Data Adjustment for approval to the Adjustment Approver, click Submit.
A confirmation message appears, confirming that the adjustment details have been successfully updated.
11. Click OK.
The Adjustment Rules Details page automatically closes.
12. Log in as a Data Adjustment Approver and approve this Data Adjustment.
After creating Data Adjustments, perform these procedures to check the Data Quality of the data corrections made during the Data Adjustment process.
Execution of Adjustments
The adjustments defined by using the steps mentioned earlier are executed through the batch. The executable DataAdjustment.sh must be executed with a list of parameters. Note that an adjustment is considered for execution for the MIS data for which the data adjustment has been done.
NOTE:
Only an issue owner can trigger the adjustment batch.
To trigger the adjustment batch from the Issue screen, follow these steps:
1. From Regulatory Reporting Data Sets and Governance for Asia Pacific and Middle East Jurisdictions window navigate to Controls.
2. Select a stage
table and then click  View
Controls to view the details.
3. Click Issues
& Actions.
The system-generated issues for this control are displayed.
4. Select an
issue for which the adjustment is created and click Run.
The Adjustment Run Parameters window is displayed.
The Issue Name is displayed as default.
5. Click  to
select the MISDATE for execution.
The RunSkey is automatically selected based on the MIS date.
6. Click  to
select the Legal Entity Code from the list of hierarchy.
NOTE:
If the hierarchy is not displayed, resave the hierarchy HIREG004 Org Structure Entity Code.
7. Click Execute.
This automatically creates a batch and is executed. The Batch Monitor status
displays as successful.
For all other types of adjustments, create a new Batch, perform the following steps:
1. From Regulatory Reporting Data Sets and Governance for Asia Pacific and Middle East Jurisdictions window navigate to Operations and then select Batch Maintenance.
2. To create
a Batch, in the Batch Name section, click the  icon.
icon.
Figure 93: Batch Maintenance
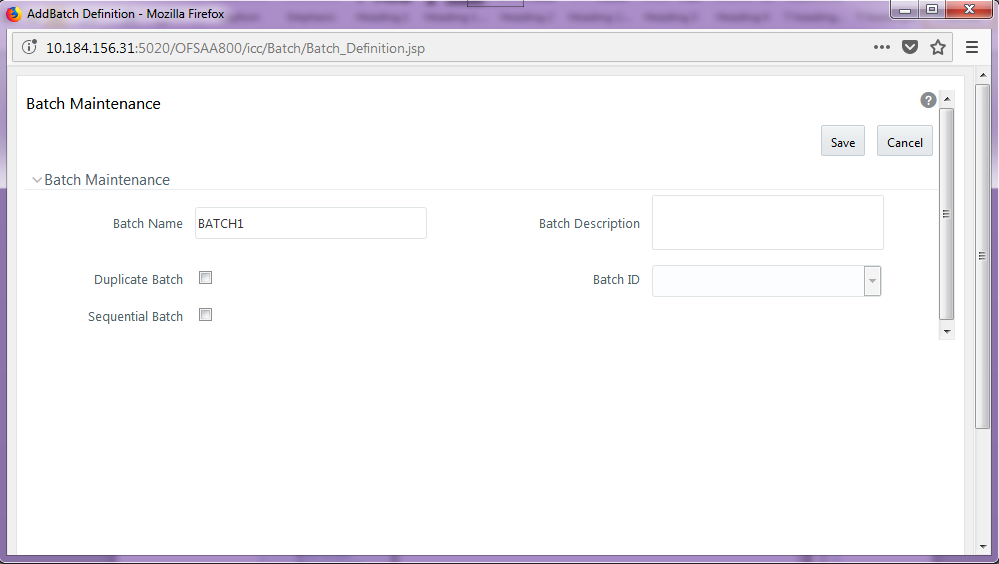
3. In the Add Batch Definition window, enter the batch name and the batch description, and then click Save.
4. In the Batch Maintenance pane, in the Batch Name section, select the Batch Name checkbox associated with the newly created batch. The Task Details section appears which lists the tasks corresponding to the selected Batch Name.
5. To add a new task to the newly created batch, click the Add icon.
6. In the Task Definition window In the Components dropdown box, select the RUN EXECUTABLE value.
7. The values are automatically generated for the Datastore Type, Datastore Name, and IP Address fields.
8. In the Executable field, enter the value DataAdjustment.sh, <ISSUE NAME>, <USER>, <RUNSKEY>, <LEGAL ENTITY>.
NOTE:
Except for the data adjustment for regulatory reporting, which will require all five values, the other data adjustments will only require values for <ISSUE NAME> and <USER>. The <RUNSKEY> and <LEGAL ENTITY> parameters can be placed as NA.
9. For the Wait field, select either Y or N as required.
10. For the Batch Parameter field, select Y.
11. Enter the required details in all the other fields.
12. Click Save.
13. A new Task for the new Batch is created. You can run this Batch in the Batch Execution section.
To monitor the data adjustment batch through the Batch Monitor pane follows these steps:
1. From Regulatory Reporting Data Sets and Governance for Asia Pacific and Middle East Jurisdictions window navigate to Operations and the select Batch Monitor.
2. The Batch Monitor pane appears on the right-hand side.
Figure 94: Batch Monitor
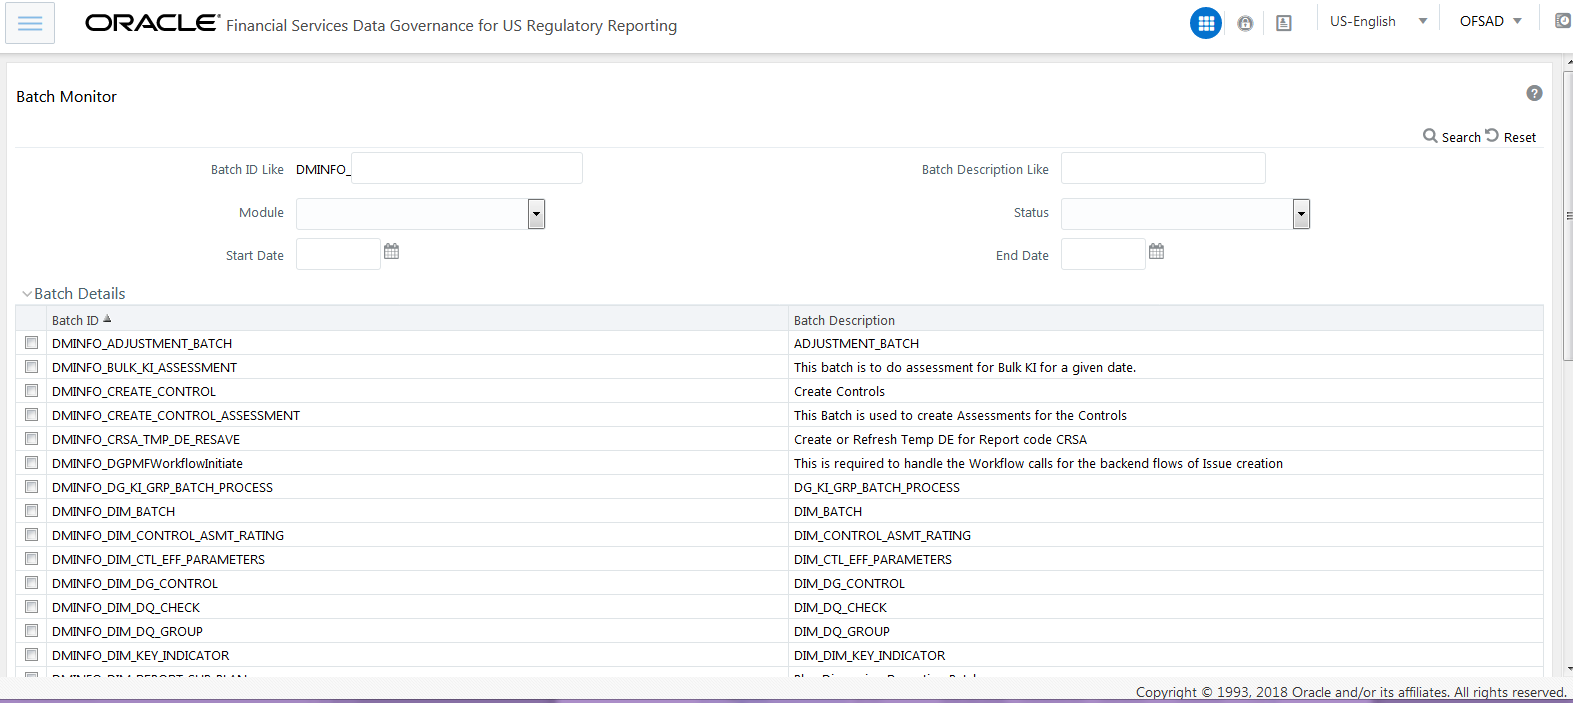
3. In the Batch Details section, select the Batch ID which was executed during the Batch Execution.
4. In the Batch, Run Details section, click the Information Date drop-down and then select the MIS Date. This is the date on which the Data Quality had failed at the staging.
5. Click the Batch Run ID dropdown box and select the required value.
6. Click the Start Monitoring icon.
7. The Batch Status, Task Details, and Event Log sections appear in addition to the existing details in the Batch Monitor pane.
8. Select any task in the Task Details section to view its Event Log details.
9. After the successful execution of the data adjustment batch, the Action Owners must mark the action progress to 100% or mark the Action as completed.
NOTE:
Based on the adjustment type, check the tables against which the adjustments have been passed.
The dashboards provide reports for various sections in the DGRR Application.
The Data Quality Rules for Dashboards must be executed through batches only and not through the DQ screen.
For Data Quality refer to the APME (APRA/RBI/MAS) Run Chart and execute the batch DGS_DQ_CTL_BATCH, DataProfile for the date on which the data quality check needs to be executed. Refer to the APME (APRA/RBI/MAS) Run Chart for further details.
Based on the Data Quality check defined in the DQ framework of AAAI, the dashboard generates the reports. These are predefined values. The dashboard also generates the reports based on the check type the user wants to analyze the data with.
The Data Quality Dashboard provides data based on selecting the desired Date and the following list of dropdowns:
· Batch Name
· DQ Group Name
· DQ Type
· Date
· Iteration
Click Apply to generate the reports.
Click Reset to reset the values.
The first grid displays the following data:
· Pass DQ percentage (Green shows the pass DQ %)
· Fail DQ percentage (Red shows the failed DQ %)
· Number of Total Records
· Number of Valid Records
· Number of Invalid Records
· Number of entities, attributes, and DQ checks
Figure 95: Data Quality Dashboard

This analysis displays the distribution of error records based on a range of attribute counts in the form of pie charts and bar graphs.
Figure 96: Distribution of Error Records by the Attribute Count

Click either on the pie chart or bar graph to drill down to view the following details:
· Entity
· Attributes
· DQ Check Type Name
· Percentage of Rejected Records Count
Click Attributes to display the following:
· Data Profile: It displays 2 analyses:
§ Data Profile: A tabular representation of the following data based on the Entity-Attribute Name:
— Count Distinct values
— Count Null Values
— Max Value
— Mean Value
— Minimum Value
— Outliers - Greater than 2x mean
— Outliers - Less than 2x mean
— Total Row Count
Figure 97: Data Profile-

§ Trend of Data Profile: This report shows the trend of data profiling in a 6-month interval from the selected date. It is a Graphical representation of the following data based on the Entity-Attribute Name:
— Count Distinct values
— Count Null Values
— Total Row Count
Figure 98: Trend of Data Profile

· Data Bucket: It displays 2 analyses:
§ Data Bucket: This is the tabular representation of the following data based on Dimension Table:
— Node Code
— Distribution Count
Figure 99: Data Buckets

§ Trend of Data Bucket: This report shows the trend of the data profiling in a 6-month interval from the selected date. It is a graphical representation of the Distribution Count and Node Codes against time intervals. The Trend of Data Buckets includes two types of graphs:
— Bar Graph
— Line Graph
Figure 100: Trend of Data Buckets

This analysis displays the distribution of error records based on the error type.
Figure 101: Distribution of Error Records by Error Type

Click either the pie chart or the bar graph to get a drill down to view the following details:
· Entity
· Attributes
· DQ Check Type Name
· Percentage of Rejected Records Count
Click Attributes to view the following:
· Data Profile: It displays two analyses:
§ Data Profile: A tabular representation of the following data based on the Entity-Attribute Name:
— Count Distinct values
— Count Null Values
— Max Value
— Mean Value
— Minimum Value
— Outliers - Greater than 2x mean
— Outliers - Less than 2x mean
— Total Row Count
Figure 102: Data Profile

§ Trend of Data Profile: A graphical representation of the following data based on the Entity-Attribute Name:
— Count Distinct values
— Count Null Values
— Total Row Count
· Data Bucket: It displays two analysis:
§ Data Bucket: The tabular representation of the following data based on the Dimension Table:
— Node Code
— Distribution Count
Figure 103: Data Bucket
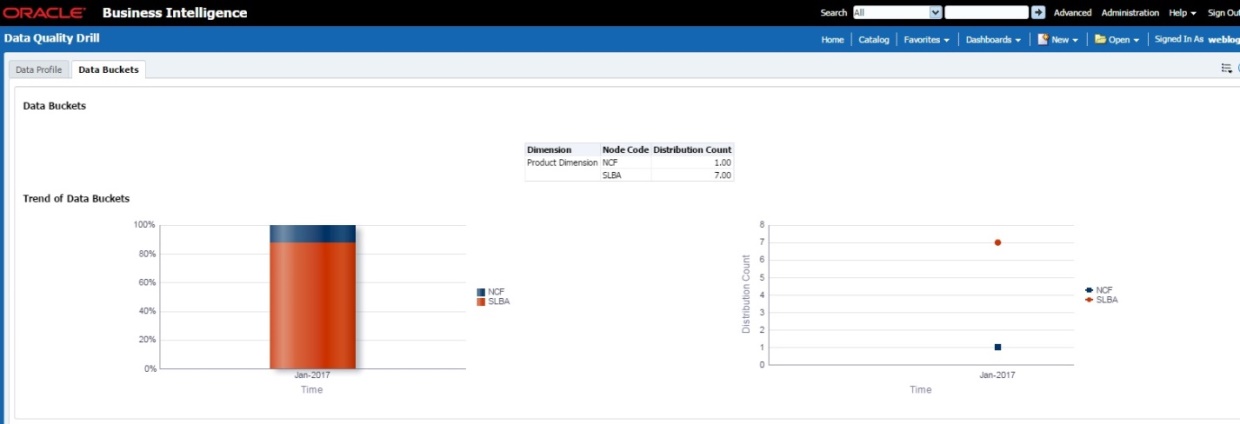
§ Trend of Data Bucket: Graphical representation of the Distribution Count and Node Codes against time intervals. The Trend of Data Buckets includes two types of graphs:
— Bar Graph
— Line Graph
This analysis displays the distribution of default records based on the attribute count.
Figure 104: Distribution of Defaults by Attribute Count

Click either the pie chart or bar graph to get a drill down which displays the following details:
· Entity
· Attributes
· DQ Check Type Name
· Percentage of Rejected Records Count
Click Attributes to display the following:
· Data Profile: It displays two analysis:
§ Data Profile: A tabular representation of the following data based on Entity-Attribute Name:
— Count Distinct values
— Count Null Values
— Max Value
— Mean Value
— Minimum Value
— Outliers - Greater than 2x mean
— Outliers - Less than 2x mean
— Total Row Count
Figure 105: Data Profile

§ Trend of Data Profile: Graphical representation of the following data based on the Entity-Attribute Name:
— Count Distinct values
— Count Null Values
— Total Row Count
· Data Bucket: It displays two analysis:
§ Data Bucket: The tabular representation of the following data based on the Dimension Table:
— Node Code
— Distribution Count
Figure 106: Data Buckets
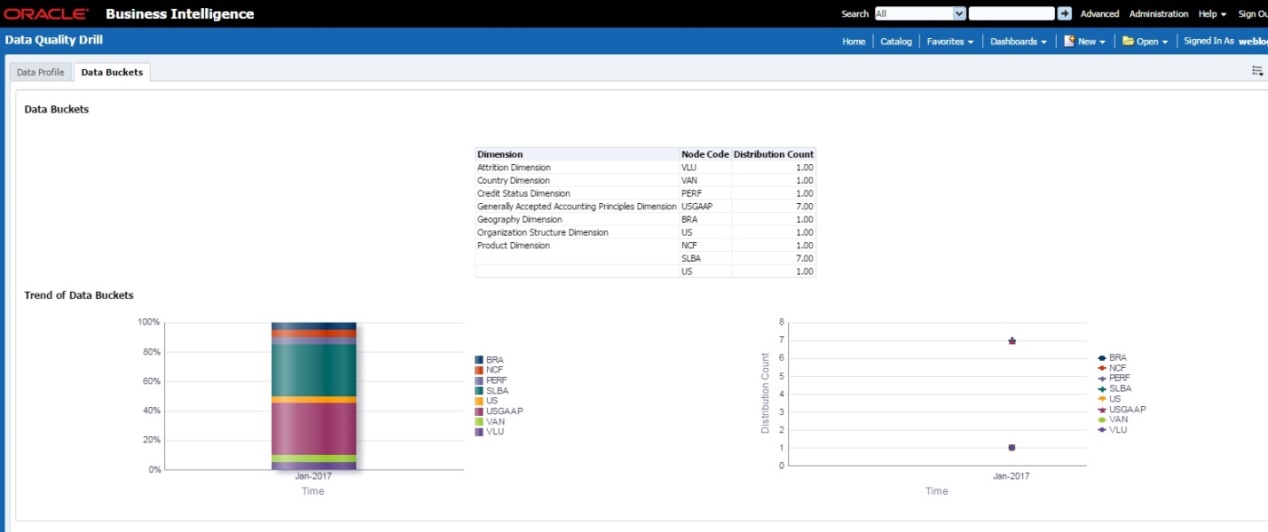
§ Trend of Data Bucket: A graphical representation of the Distribution Count and Node Codes against time intervals. The Trend of Data Buckets includes two types of graphs:
— Bar Graph
— Line Graph
Populating Data for DQ Exception Report (Data Quality Dashboard)
Before verifying the Data Quality Exception Report dashboard (DQ Dashboard), follow these steps:
1. Navigate to Common Tasks > Operations > Batch Maintenance.
2. Select the DGS_DQ_CTL_BATCH batch. See OFS Data Governance Run Chart for more details.
NOTE:
The FSI_DGS_DQ_BALANCE_COL_MAP table will have the configuration details required for DQ-Exception amount calculations.
It consists of the following columns.
Column Name |
Description |
|---|---|
V_DQ_STG_TBL |
Column to store Stage Table Name |
V_DQ_STG_BAL_AMT_COL |
Column to store Data Quality Exception Balance Column to be used for DQ-Exception Amount Calculations |
V_PK_REFERENCE_COL |
Column to store Primary Key of the Stage Table |
By default, the tables are packaged with the following metadata configurations.
V_DQ_STG_TBL |
V_DQ_STG_BAL_AMT_COL |
V_PK_REFERENCE_COL |
|---|---|---|
STG_BORROWINGS |
N_EOP_BAL |
V_ACCOUNT_NUMBER |
STG_CARDS |
N_EOP_BAL |
V_ACCOUNT_NUMBER |
STG_CASA |
N_EOP_BAL |
V_ACCOUNT_NUMBER |
STG_COMMITMENT_CONTRACTS |
N_COMMITMENT_AMT |
V_CONTRACT_CODE |
STG_CREDIT_LINE_DETAILS |
N_LINE_UTILIZED_AMT |
V_CREDIT_LINE_CODE |
STG_FORWARDS |
N_EOP_BAL |
V_CONTRACT_CODE |
STG_INVESTMENTS |
N_EOP_BAL |
V_ACCOUNT_NUMBER |
STG_LC_CONTRACTS |
N_EOP_BAL |
V_CONTRACT_CODE |
STG_LEASES_CONTRACTS |
N_EOP_BAL |
V_ACCOUNT_NUMBER |
STG_LOAN_CONTRACTS |
N_EOP_BAL |
V_ACCOUNT_NUMBER |
STG_OD_ACCOUNTS |
N_EOP_BAL |
V_ACCOUNT_NUMBER |
STG_REPO_CONTRACTS |
N_EOP_BAL |
V_CONTRACT_CODE |
STG_TD_CONTRACTS |
N_EOP_BAL |
V_CONTRACT_CODE |
STG_ACCT_RECOVERY_DETAILS |
N_PRIN_RECOVERY_AMT |
N_PRIN_RECOVERY_AMT |
STG_ACCT_WRITE_OFF_DETAILS |
N_PRIN_WRITE_OFF_AMT |
V_ACCOUNT_NUMBER |
NOTE:
Before running the DGS_DQ_CTL_BATCH, ensure the required configuration details are updated and available in the FSI_DGS_DQ_BALANCE_COL_MAP table.
The enhanced Data Quality Control functionality analyzes the impact of Data Quality failure on Regulatory Reporting based on Data Source. The report helps analyze the impact of Data Quality failure on a Cell value, and there is an option to drill down to account granularity to identify failed accounts. The analysis provides a Dashboard, Summary report, and Data Quality drill down report.
The following are the reports provided under Impact Summary.
· Impact Summary - Data Quality Impact Detail
· Click the Data Quality Map or the Stage Entity, to view the Impact Analysis.
Figure 107: Impact Summary
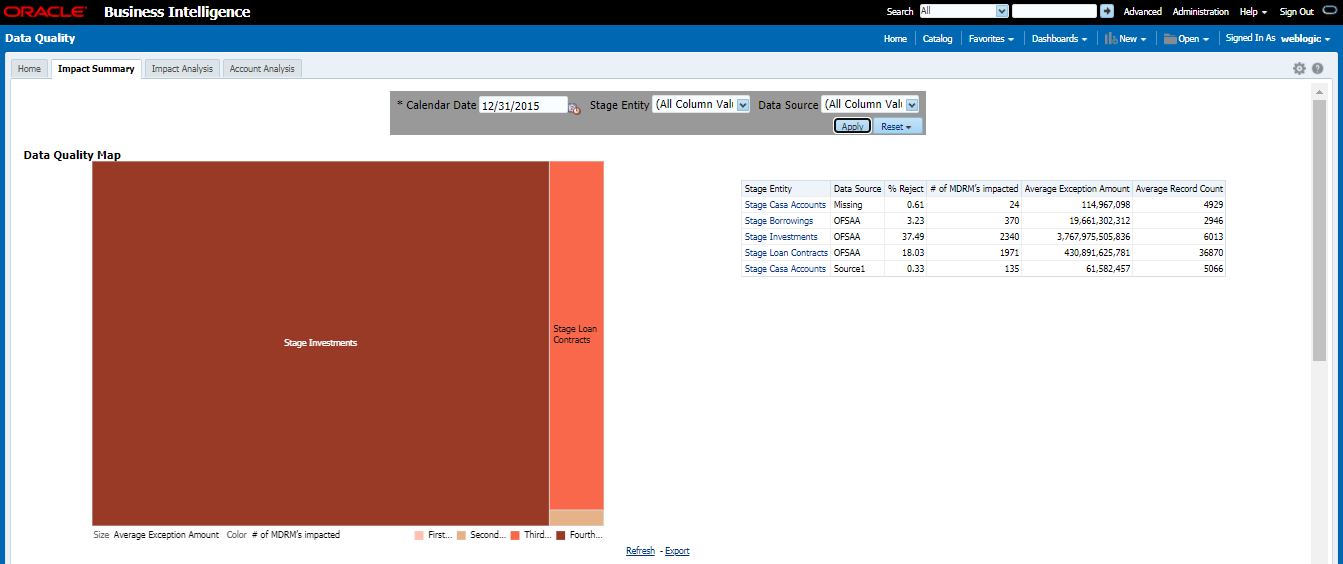
Or, click the DQ Code under Data Quality Impact Detail to view the Impact Analysis.
Figure 108: Data Quality Impact Detail
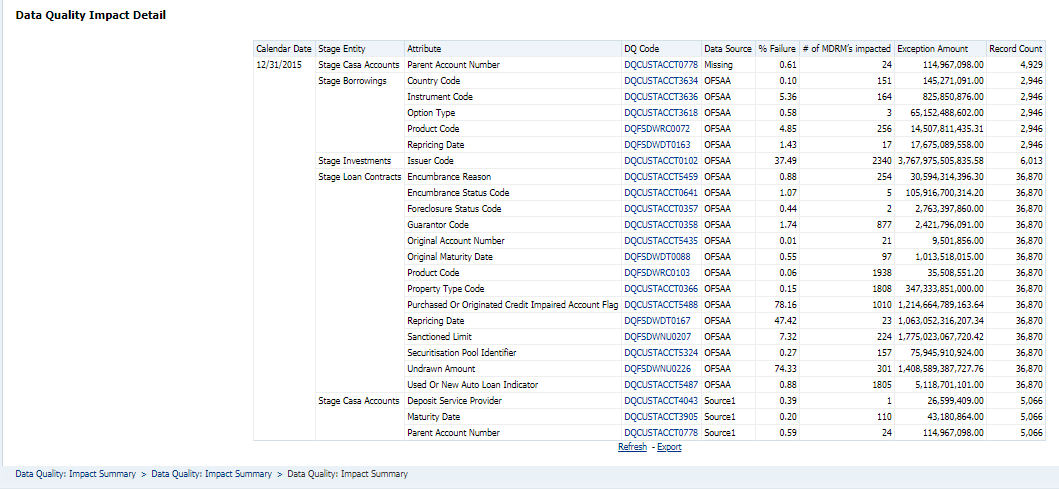
· Impact Analysis - Summary Drill-Down Report
· For the Stage, Table selected the DQ Codes, Cell Identifiers, Legal Entity, DQ details, Threshold Breach, Impacted Exception Amount, Final Cell value, and Impacted Cell Value are displayed.
Figure 109: Impact Analysis
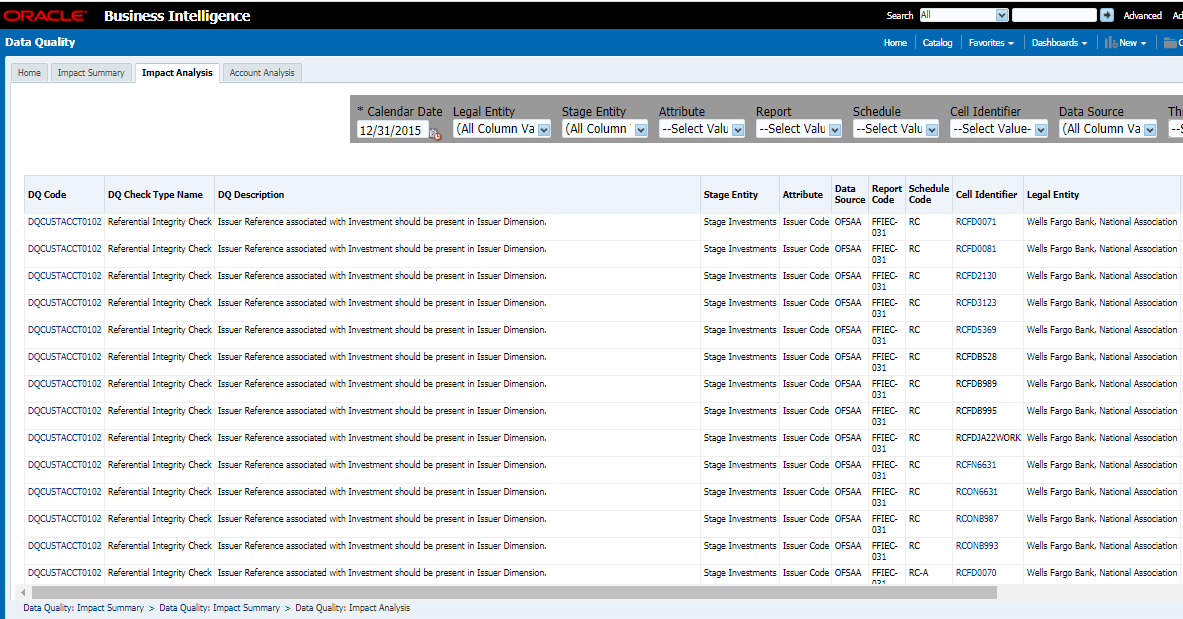
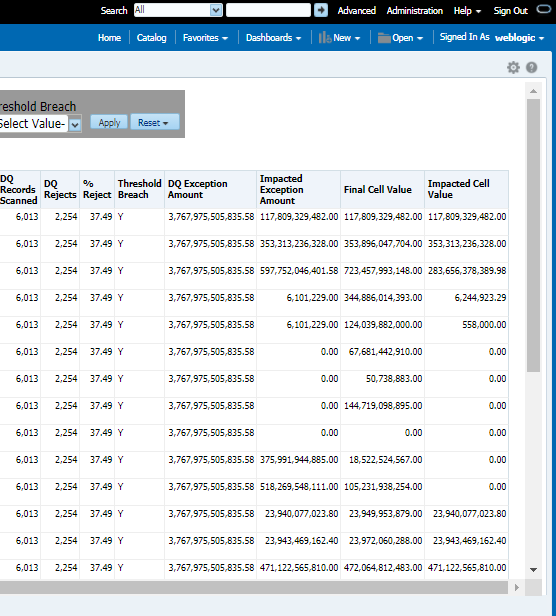
· Account Analysis Drill-Down Report
· Click the DQ Code link in Impact Analysis to view the Account Analysis Report. This report displays the Account Number associated and the Exception Amount for the Account Balance based on the Data Source.
Figure 110: Account Analysis
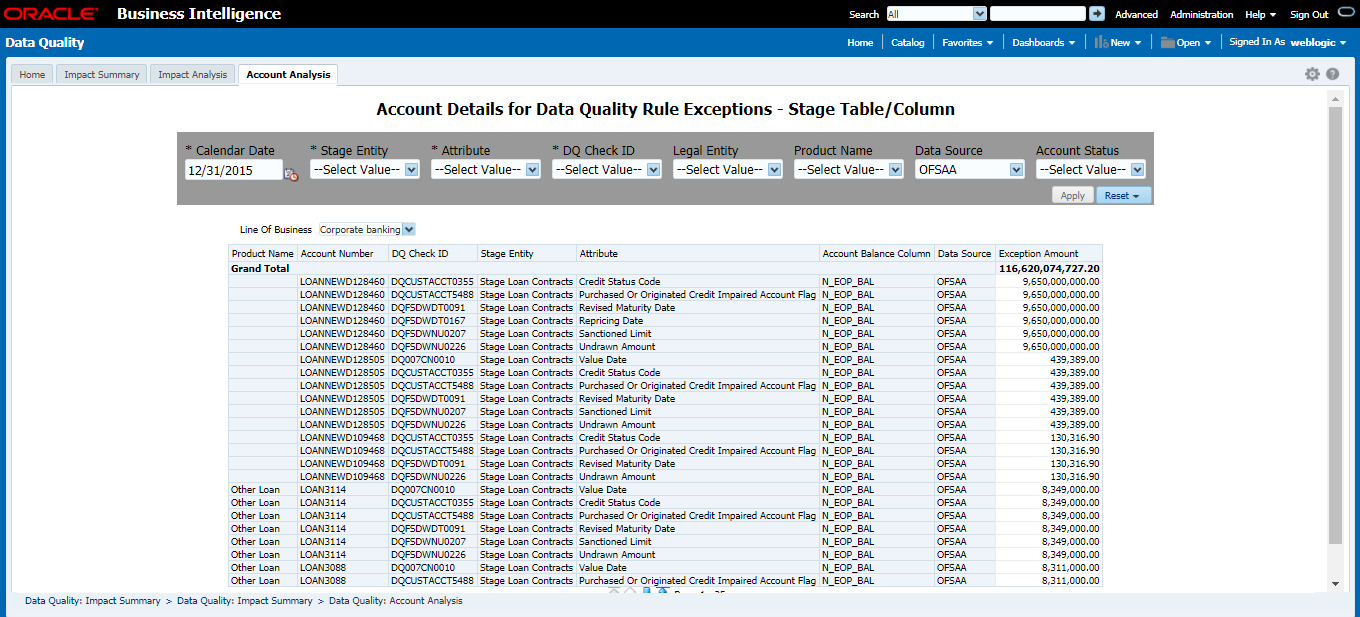
· Click the Cell Identifier link in Impact Analysis to view the Cell drill-down report.
Figure 111: Account Details
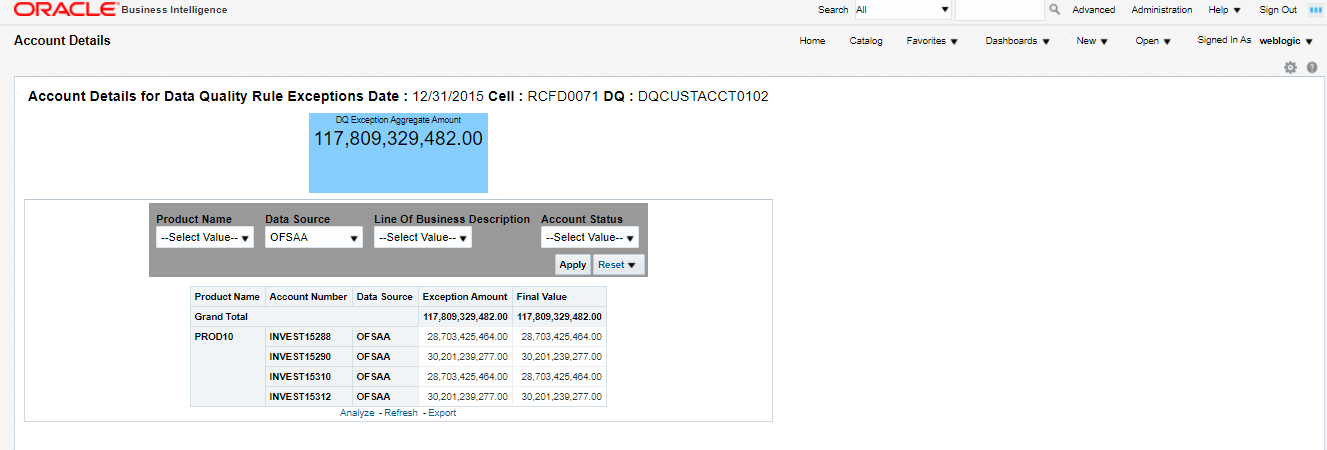
Execute the batches corresponding to Controls to view the Controls dashboards. For Controls Dashboard refer to the APME (APRA/RBI/MAS) Run Chart and execute the batch DGS_DQ_CTL_BATCH for the date on which the control and assessment need to be executed. Refer to the APME (APRA/RBI/MAS) Run Chart for further details.
This section displays two dashboard pages:
· Summary
· Controls by Regulatory Reports
Select the date to generate the dashboard reports.
The following are the types of Controls that appear as the Performance Tiles in the Controls module:
· Total Controls: Provides the number of total controls present in the system.
· Quality Control: Provides the number of Quality controls present in the system.
· Operational Control: Provides the number of operational controls present in the system.
· Ineffective Controls: Provides the number of ineffective controls present in the system.
· Issues: Provides the number of issues present in the system.
· Action: Provides the number of actions present in the system.
Figure 112: Summary
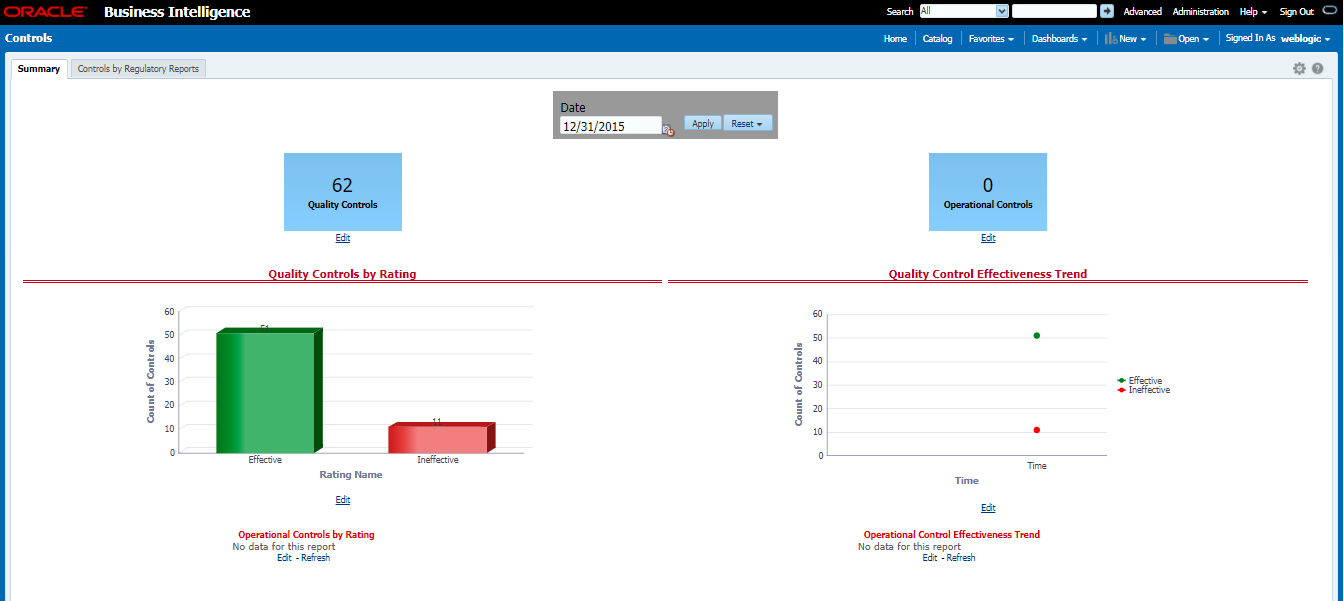
This section provides the graphical representation of the Number of Controls against Quality Controls. The following are the types of Rating Names:
· Effective
· Ineffective
Figure 113: Quality Controls by Rating
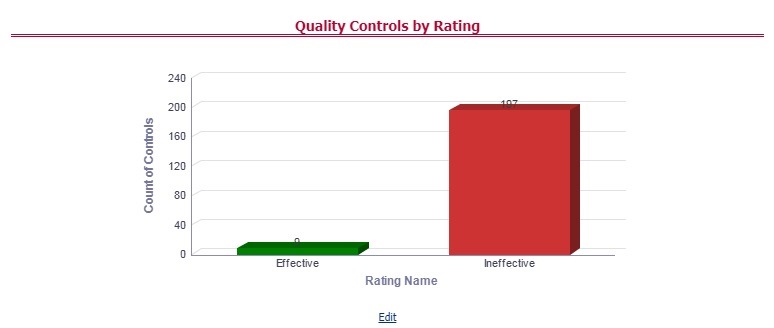
1. Click the graphs to view the drill-down Control Assessment reports. The following data appears under the Control Assessment Details dashboard:
§ Control ID
§ Control Name
§ Number of DQ checks
§ Assessment ID
§ Assessment Date
§ Effective Score
§ Rating Name
Figure 114: Control Assessment Details
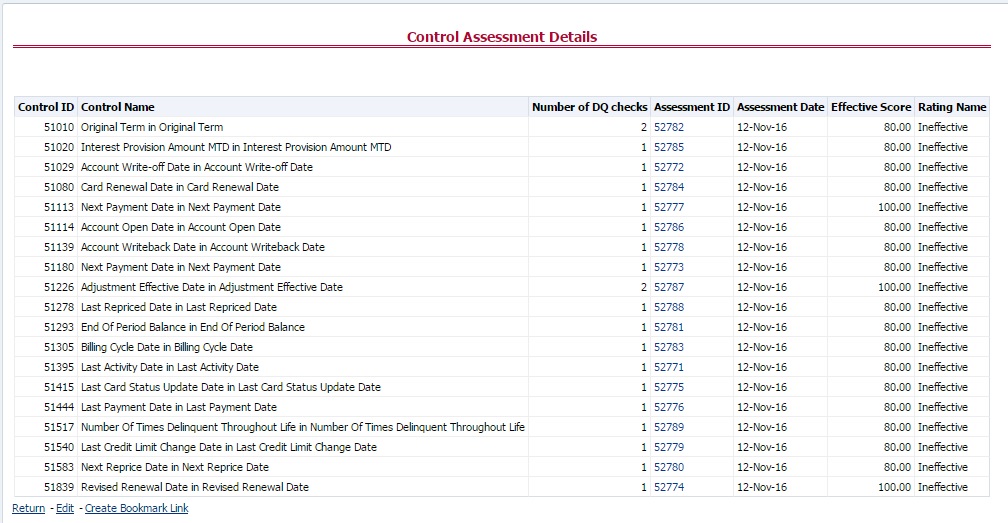
2. In the Assessment ID column, click the required link to view the drill-down Control Parameter Score.
Figure 115: Control Parameter Score

This section provides the graphical representation of the Number of Quality Controls within six months from the selected date.
Figure 116: Quality Control Effectiveness Trend
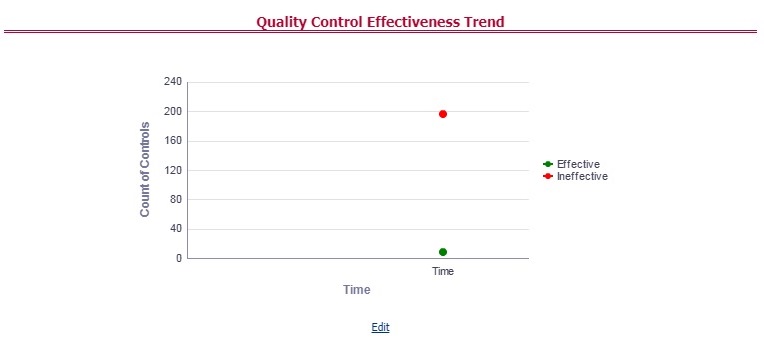
1. Click the graphs to view the drill-down Control Assessment reports.
The following data appears under the Control Assessment dashboard:
§ Control ID
§ Control Name
§ Number of DQ checks
§ Assessment ID
§ Assessment Date
§ Effective Score
§ Rating Name
2. Click Assessment ID to view the drill-down Control Parameter Score.
This section provides the graphical representation of the Number of Controls against Operational Controls. The following are the types of Rating Names:
· Effective
· Ineffective
Figure 117: Operational Controls by Rating
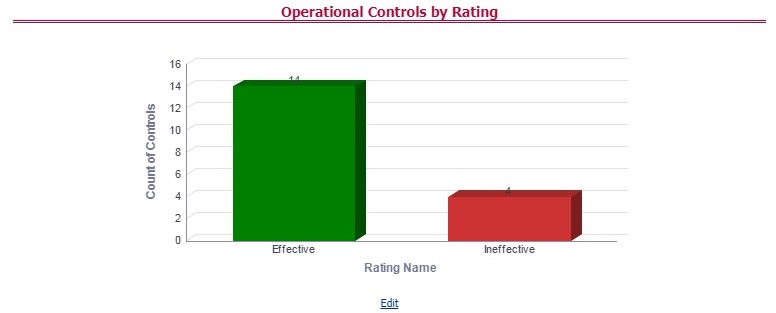
1. Click the graphs to view the drill-down Control Assessment reports. The following data appears under the Control Assessment dashboard:
§ Control ID
§ Control Name
§ Number of DQ checks
§ Assessment ID
§ Assessment Date
§ Effective Score
§ Rating Name
2. Click Assessment ID to view the drill-down Control Parameter Score.
This section displays the Data Quality associated with the control along with the data source and the number of scanned records and error information and warning.
To open this report, follow these steps:
1. From the Dashboards, select Controls.
2. Click Quality Controls and then select a required Control ID. This displays the data quality associated with the control with their data source along with total records scanned and error records.
Figure 118: Control DQ

Select the desired Regulatory Report and Date and then click Apply to view the Control Assessment Analysis dashboard.
The following details are listed in the Control Assessment Analysis report:
· Rating Name
· Reporting Line Item
Figure 119: Controls by Regulatory Reports

Key Indicators dashboard displays the various types of reports based on the analysis of the Key Indicators in the system. For the Key Indicators, Dashboards refer to the APME (APRA/RBI/MAS) Run Chart and execute the batch DGS_KI_BATCH for the date on which the Key Indicator needs to be executed. Refer to the APME (APRA/RBI/MAS) Run Chart for further details.
NOTE:
The Key Indicators dashboard will reflect only those KIs for which the report or schedules or cells have been configured in the KI configuration.
The Key Indicators Dashboard provides data based on selecting the values from the following list of dropdowns:
· Jurisdiction
· Report Code
· Schedule Code
· Cell ID
· Legal Entity
· Date
Click Apply to generate the reports.
Click Reset to reset the values.
The Summary tab consists of these performance tiles:
· Total Key Indicator Count: Displays the total number of Key Indicators.
· Breached Key Indicator Count: Displays the total number of Breached Key Indicators.
· Issue Count: Displays the total number of Issue-based Key Indicators.
· Actions: Displays the total number of Action based Key Indicators.
Figure 120: Key Indicators

These are the KI Summary dashboard sections:
· Rating Distribution for KIs: Displays the latest rating distribution for the assessed Key Indicators.
Figure 121: Rating Distribution for KIs
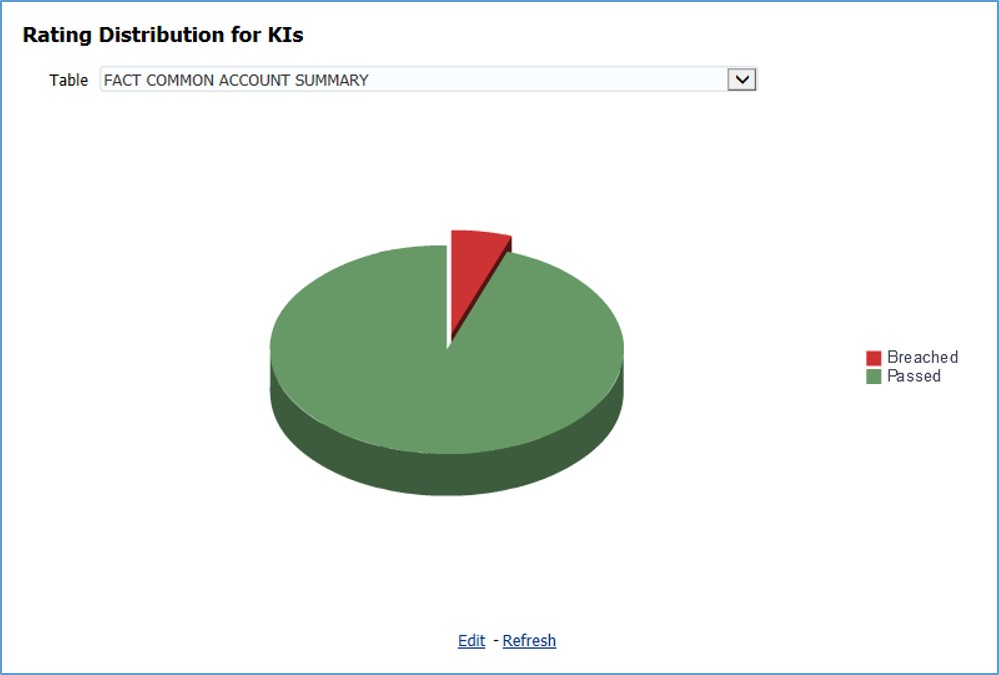
· KI Trends by Entities: Displays the trend of the latest entities for the assessed Key Indicators.
Figure 122: KI Trends by Entities
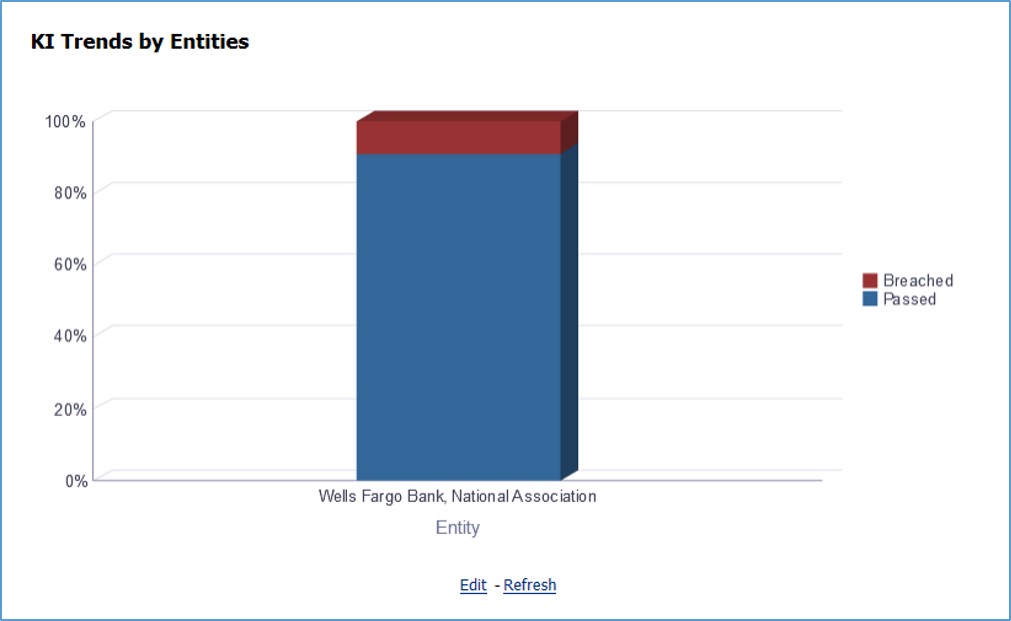
· KI Trends across multiple executions: Displays the latest trend across multiple executions for the assessed Key Indicators.
Figure 123: KI across multiple executions
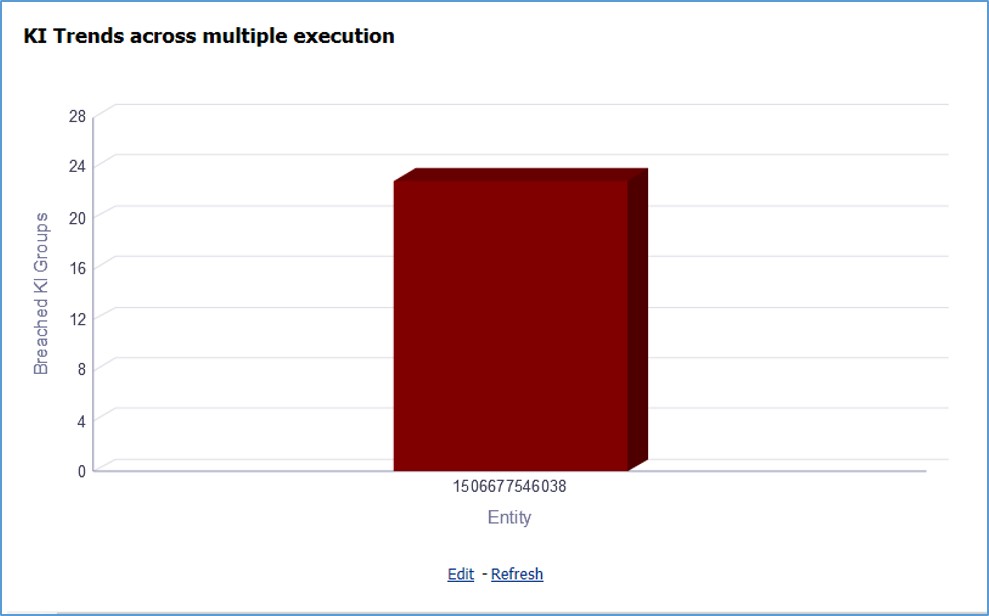
· Issues and Actions:
Figure 124: Issues and Actions
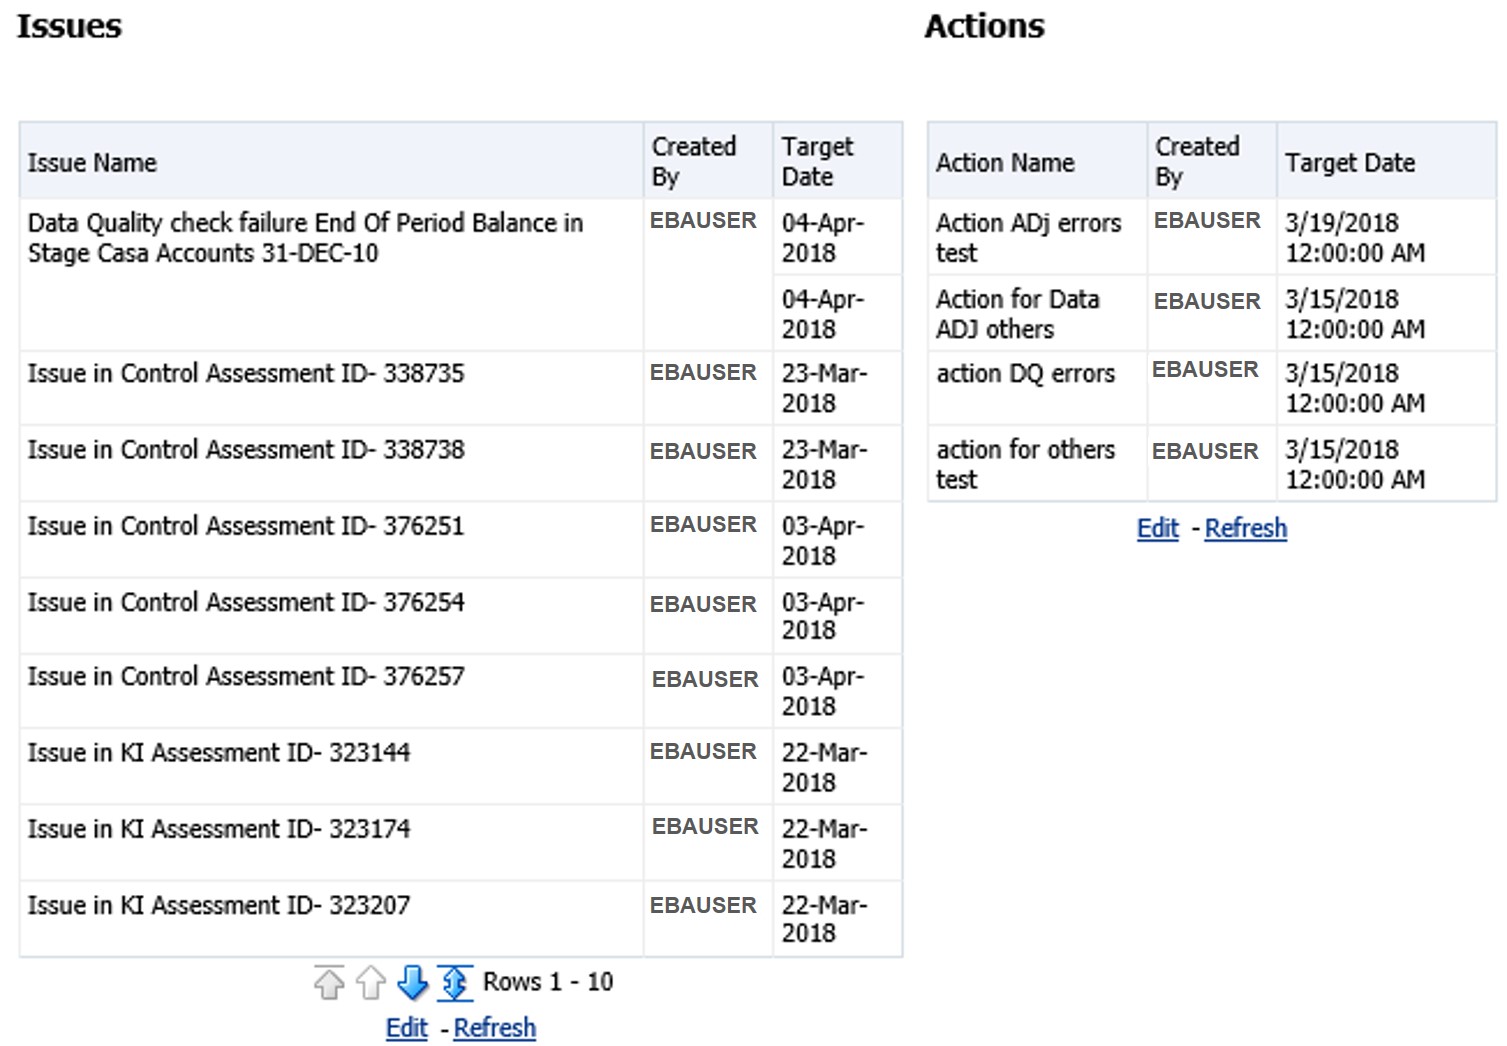
· To view the Key Indicator details:
To view the Key Indicator details for a performance tile, click that performance tile.
The following Key Indicator details appear:
· Key Indicator ID
· Key Indicator Name
· Key Indicator Description
· Entity
· Attribute
Figure 125: Breached Key Indicator Details
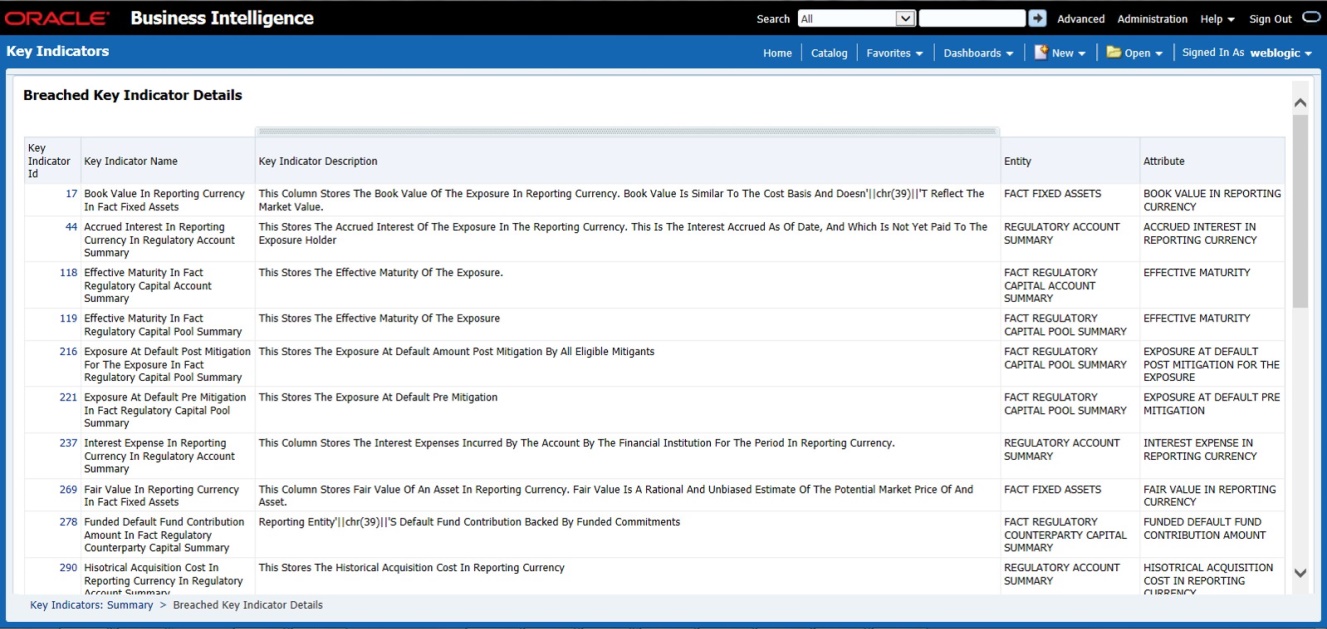
To view the Key Indicator Conditions details for a Key Indicator, click the required Key Indicator ID.
The Key Indicator Conditions page with dashboards appears.
Figure 126: Key Indicator Conditions

The Key Indicator Conditions page displays different Conditions based on which Key Indicators are assessed.
These are the sections of the Key Indicator Conditions dashboards:
· Rating Distribution for Variance KIs: This report displays the latest rating distribution for the assessed Variance Key Indicators.
Figure 127: Rating Distribution for Variance KIs
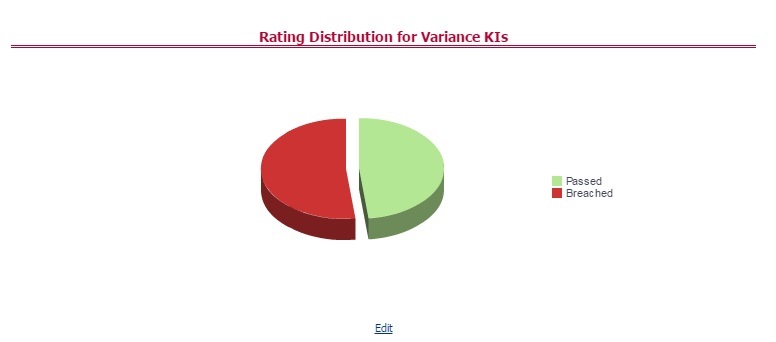
· Trend of Rating Distribution for Variance KIs: For the assessed Variance Key Indicators, this report displays the trend of the latest rating distribution.
Figure 128: Trend of Rating Distribution for Variance KIs
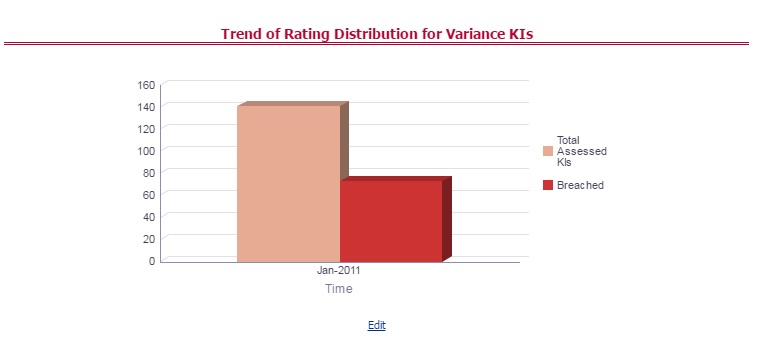
· Rating Distribution for Value-Based KIs: This report displays the latest rating distribution for the assessed Value-Based Key Indicators.
Figure 129: Rating Distribution for Value-Based KIs
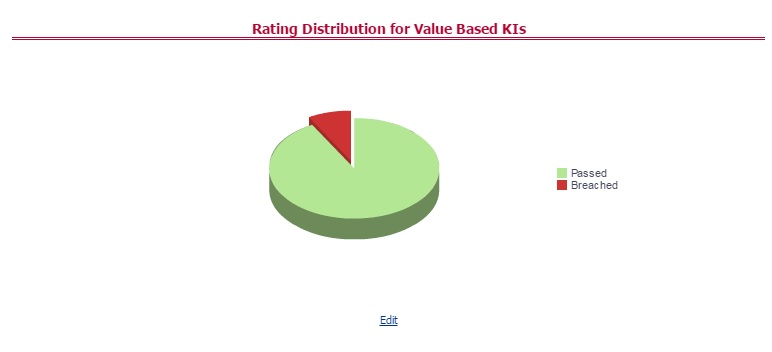
· Trend of Rating Distribution for Value-Based KIs: This report displays the trend of the latest rating distribution for the assessed Value-Based Key Indicators.
Figure 130: Trend of Rating Distribution for Value-Based KIs
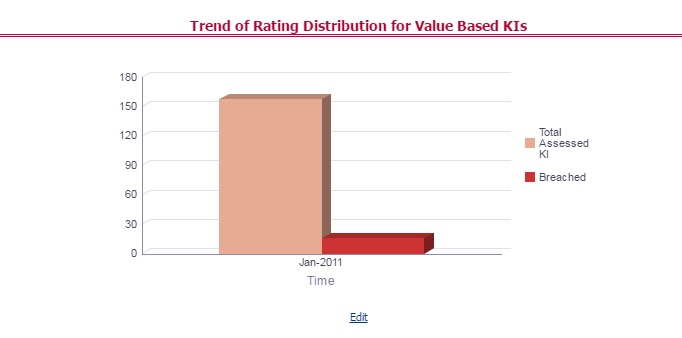
To view the Key Indicator Conditions details:
To view the Key Indicator Conditions details for a performance tile, click that performance tile. The following Key Indicator Conditions details appear:
§ Key Indicator Condition ID
§ Name
§ Description
§ Comment
§ Type
Figure 131: Key Indicator Conditions
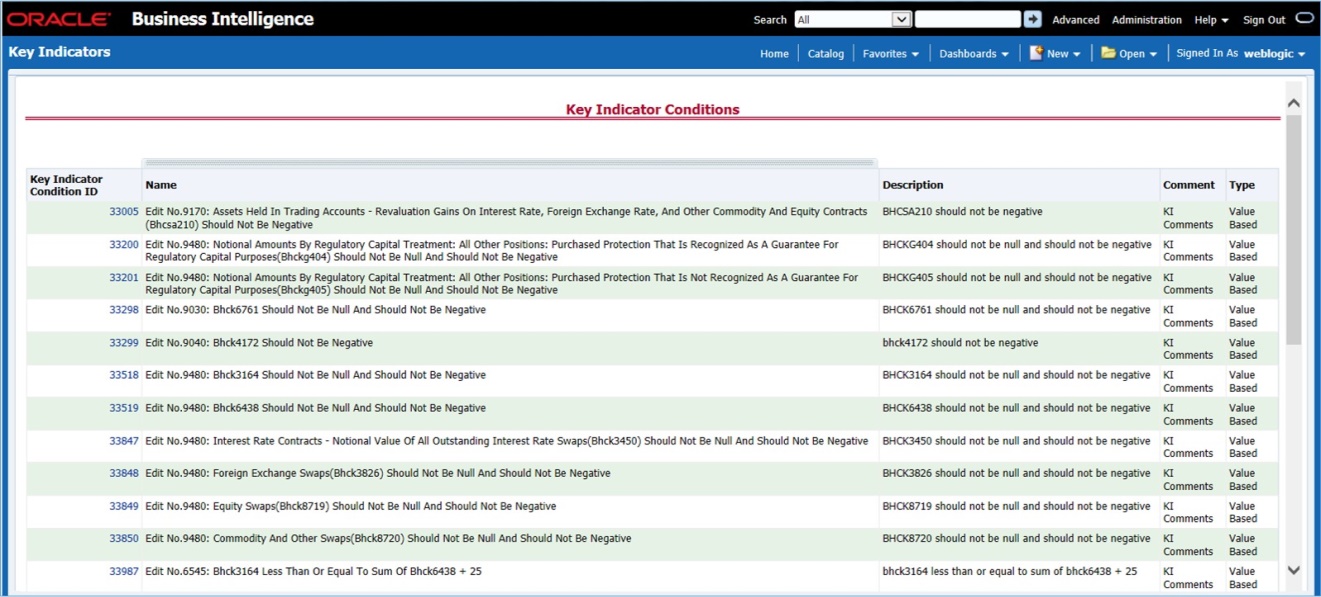
To view the Assessment Details page for a required Key Indicator Condition, click the corresponding Key Indicator Condition ID.
The Assessment Details page appears with the following details:
§ Assessment ID: This is the Assessment ID corresponding to the selected Key Indicator ID.
§ Key Indicator ID: This is the selected Key Indicator ID.
Current Period Value: The current period value for the selected Key Indicator ID.
§ Previous Period Value: The previous period value for the selected Key Indicator ID.
§ Variance: The difference in Current and Previous Period Value for the selected Key Indicator ID.
Variance %: The percentage of Variance based on the Previous Period value.
§ RAG Score: The RAG value of the selected Key Indicator depending on the various values.
§ Status: The status of the selected Key Indicators depending on the various values.
Figure 132: Assessment Details

The KIs by Regulatory Reporting page displays the Key Indicator Group Details with the following columns:
§ Key Indicator
§ Name
§ Owner
§ Status
To view the above-mentioned column values for a particular report, select the required report name in the Plan dropdown box, and column name in the Legal Entity dropdown box. Click Apply. A list of KI Group Details appears.
Figure 133: KIs by Regulatory Reporting
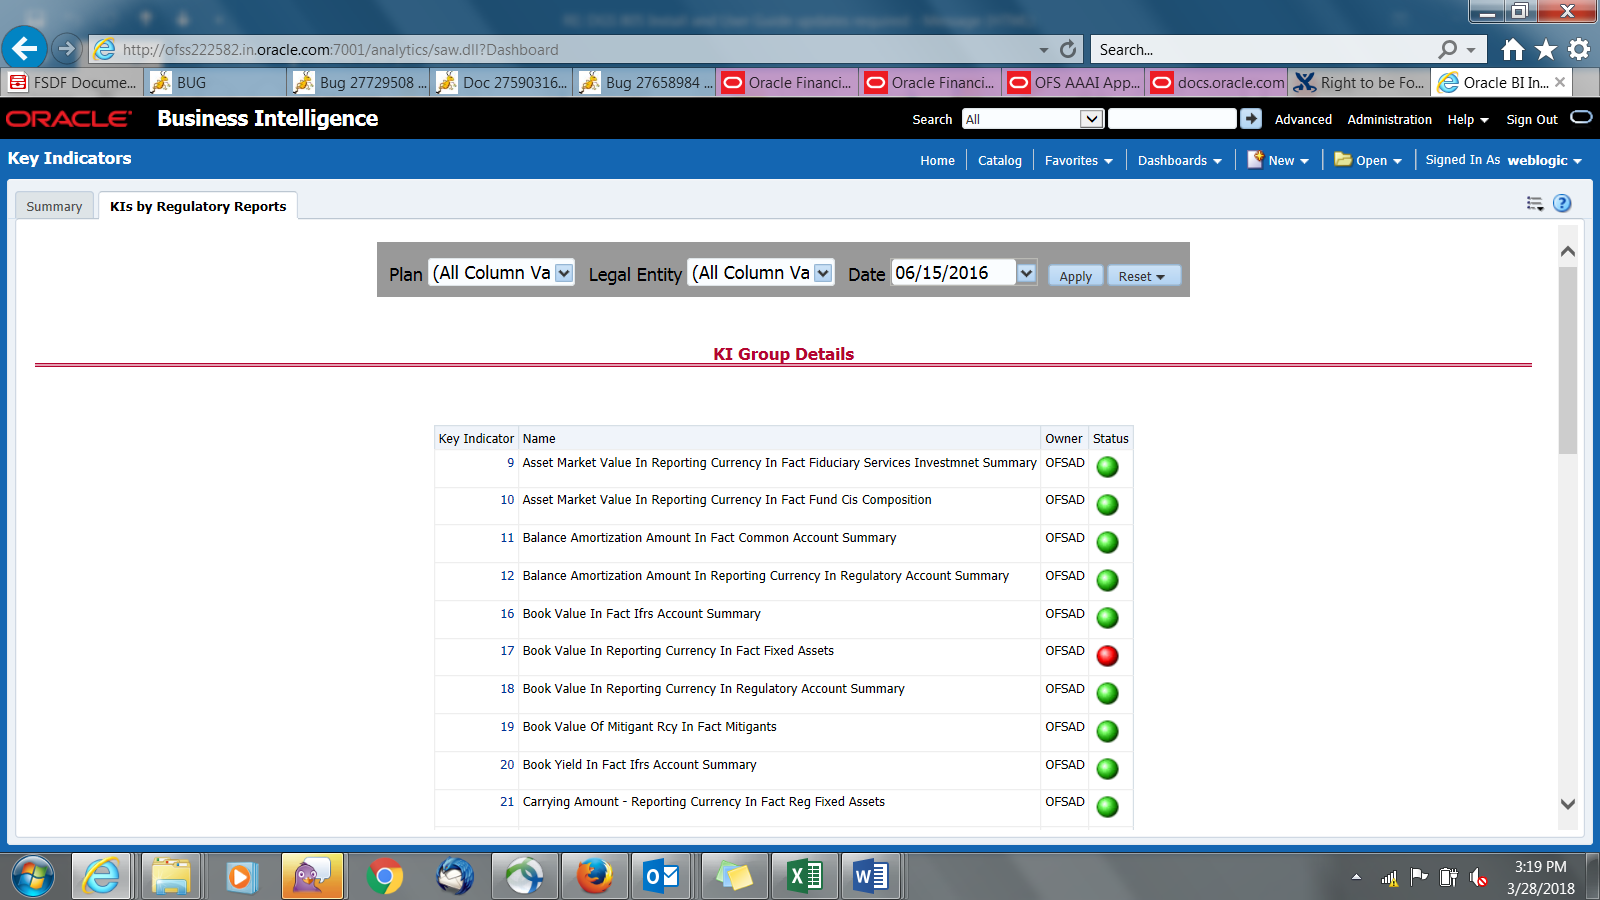
For the required Key Indicator, to view the Variance Analysis, Validation Check Analysis, and Trend Analysis, click any Key Indicator number. These details appear at the bottom of the page:
Variance Analysis: Variance Analysis provides these data for the selected report:
§ Report: Displays the reporting line item for the selected report.
§ Schedule: Displays the schedule code for the respective reporting line item.
Cell Reference: Displays the cell ID for the respective reporting line item.
§ KI Condition: Displays the KI condition name.
§ Current Value: Provides the current period value for the respective Reporting line item.
Previous Value: Provides the previous period value for the respective Reporting line item.
§ Variance %: Displays the percentage of Variance based on Previous Value.
§ Status: The status of the selected Key Indicators depending on the various values.
Dependent KIs: Displays the other Key Indicators on which this cell ID is dependent.
To view the Assessment details of the selected Key Indicator, click Dependent KIs. The Assessment Details page appears.
Validation Checks: Displays all the Value-based Key Indicators associated with that Key Indicator Group key. For the selected report, these details appear:
§ Report: Displays the reporting line item for the selected report.
Schedule: Displays the schedule code for the respective reporting line item.
§ Cell Reference: This displays the cell ID for the respective reporting line item.
§ KI Condition: Displays the KI condition name.
Status: The status of the selected Key Indicators depending on the various values.
§ Dependent KIs: Displays the other Key Indicators on which this cell ID is dependent.
· Trend Analysis: Displays the trend of total assessed Key Indicators and breached Key Indicators for a particular time interval.
Figure 134: Trend Analysis
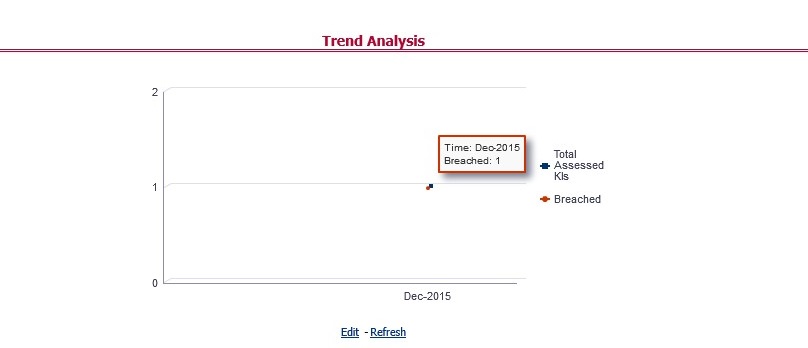
To view the Key Indicator Details drill down report, click the graph points.
Figure 135: Key Indicator Details
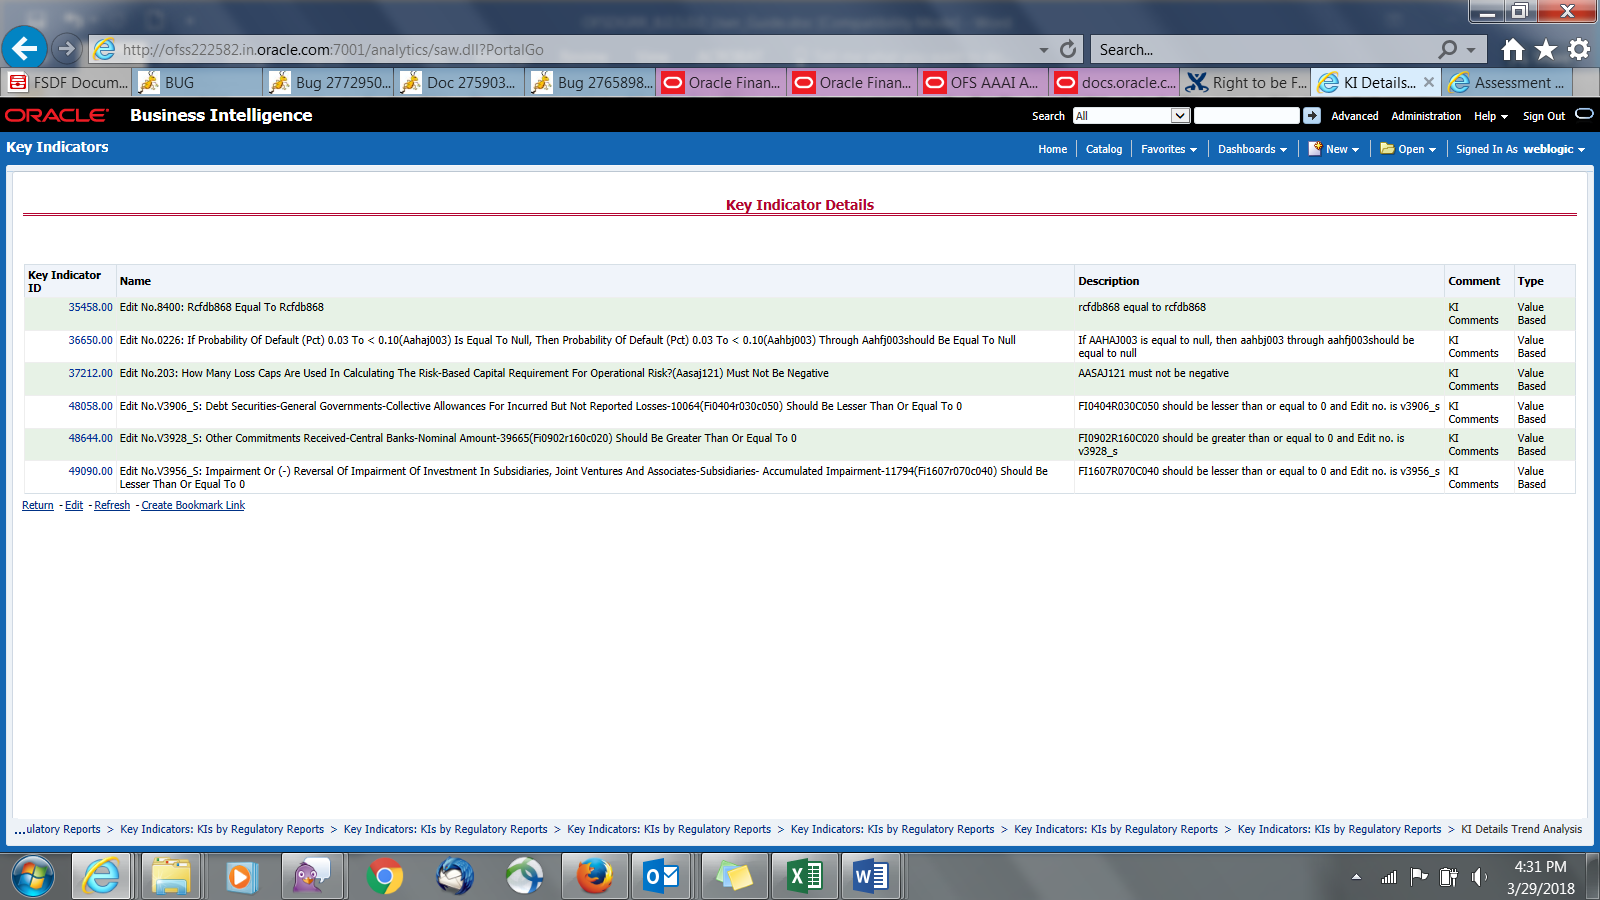
In the Key Indicator ID column, click the link of the required KI ID to view the Assessment Details report.
Select a Plan Name from the dropdown, and then select a date from the calendar and click Apply to view the Regulatory Report Monitoring.
The following values appear in terms of Performance Tiles:
§ Reporting Elements with Errors: Displays the percentage of Reporting Elements with Errors.
§ Reporting Elements with a breach in Variance Indicators: Displays the percentage of Reporting Elements associated with breached Variance Key Indicators.
§ Reporting Elements with a breach in Key Indicators: Displays the percentage of Reporting Elements associated with breached Key Indicators.
§ Reporting Elements with Control Failures: Displays the percentage of Reporting Elements associated with failed controls.
§ Issues in total: Displays the total number of issues associated with Controls and KI.
§ Outstanding Issues: Displays the total number of open issues.
Figure 136: Regulatory Report Monitoring

Regulatory Report Monitoring dashboard displays the following grids:
· Plan Analysis by Report
· Issue and Action Tracking
This analysis displays reports, schedules, and count of Reporting Elements associated with the selected Plan.
1. Select the Report Name from the drop-down to view the following data:
— Report/Schedule Name: Displays the name of the report/schedule.
— Total: Displays the number of reporting elements linked to a schedule.
— No Errors: Displays the number of reporting elements without errors.
— Variance Indicator Breach: Displays the number of reporting elements linked to the breached Variance Indicators.
— KI Breach: Displays the number of reporting elements linked to the breached Value-Based Key Indicators.
— Control Failure: Displays the number of reporting elements linked to failed controls.
Figure 137: Plan Analysis by Report

2. Click Total associated with each schedule to display the Reporting Element drill-down Report. The following details appear:
— Schedule: Displays the name of the schedule.
— Cell Reference: Displays the reporting elements associated with the schedule.
— Breached Variance KI: Displays if there are any Breached Variance KIs.
— Breached Value-Based KI: Displays if there are any Breached Value-Based KIs.
— Ineffective Control: Displays if there are any Ineffective Controls.
Figure 138: Regulatory Report Monitoring
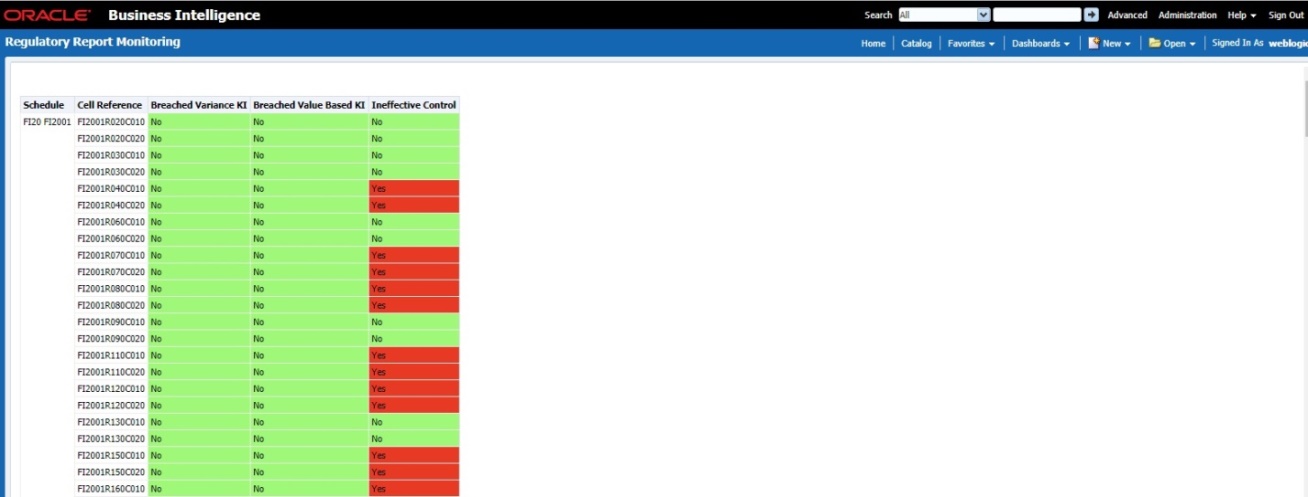
3. Click No Errors associated with each schedule to display the Reporting Element drill-down Report. The following details appear:
— Schedule: Displays the name of the schedule.
— Cell Reference: Displays the reporting elements associated with the schedule.
— Breached Variance KI: Displays if there are any Breached Variance KIs.
— Breached Value-Based KI: Displays if there are any Breached Value-Based KIs.
— Ineffective Control: Displays if there are any Ineffective Controls.
Figure 139: Regulatory Report Monitoring
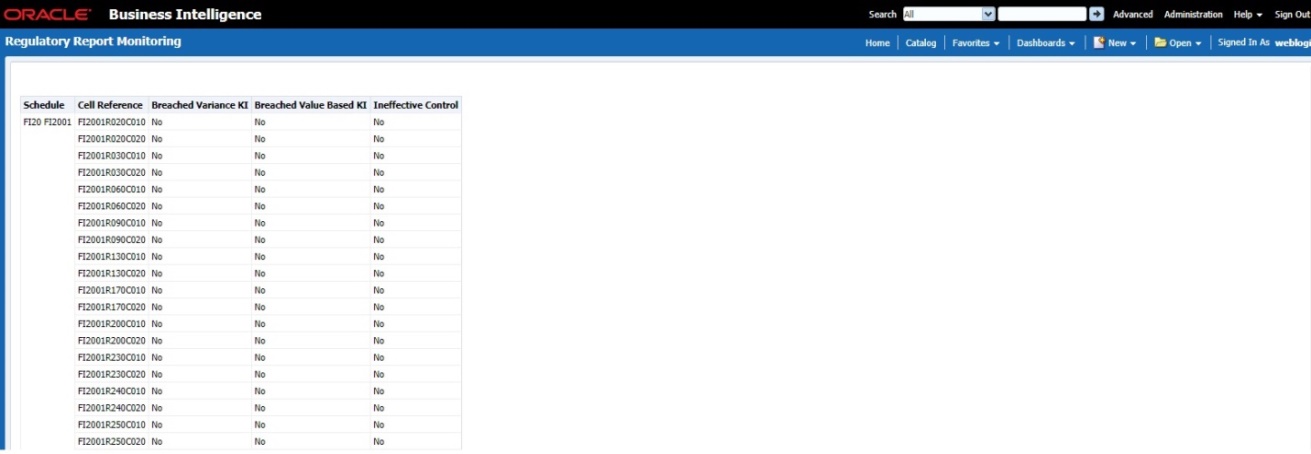
4. Click Variance Indicator Breach associated with each schedule to display the Variance Indicators and Issue Details - Variance Based Indicators drill-down Report. The following details appear in Variance Based Indicators:
— Plan Name
— Report Name
— Schedule
— Date
— Variance Indicator
— Owner
— Report
— Cell Reference
— Current Value
— Previous Value
— Variance
— Variance %
— Variance % (Last Period)
— Status
— Status (Last Period)
Figure 140: Variance Indicators
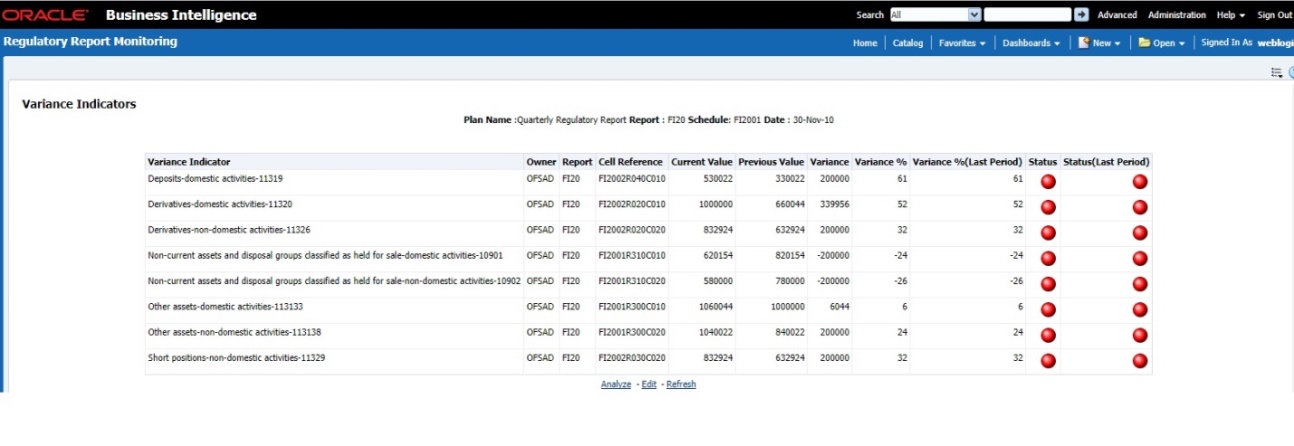
The following details appear in Issue Details-Variance Based Indicators:
— Issue Key
— Issue Name
— Variance Indicator
— Cell Reference
— Issue Owner
— Target Completion Date
— Issue Status
— Action Name
— Action Status
— Action Owner
— Create Action
Figure 141: Issue Details-Variance Based Indicators

5. Click KI Breach associated with each schedule to display Value-Based Indicators and Issue Details - Value-Based Indicators drill-down Report. The following details appear in Value-Based Indicators:
— Plan Name
— Report
— Schedule
— Date
— Name
— Owner
— Report
— Cell Reference
— Status
— Status (Last Period)
Figure 142: Value Based Indicators

The following details appear in Issue Details - Value-Based Indicators:
— Issue Name
— Key Indicator
— Cell Reference
— Issue Owner
— Target Completion Date
— Issue Status
— Action Name
— Action Status
— Action Owner
— Create Action
Figure 143: Value Based Indicators

6. Click Control Failure associated with each schedule to display Control details and Issue Details Value-Based Indicators drill-down Report. The following details appear in Control Details:
— Plan Name
— Report
— Schedule
— Date
— Control Name
— Data Quality Checks
— Owner
— Effectiveness
— Cell Reference
Figure 144: Control Details Schedule Report
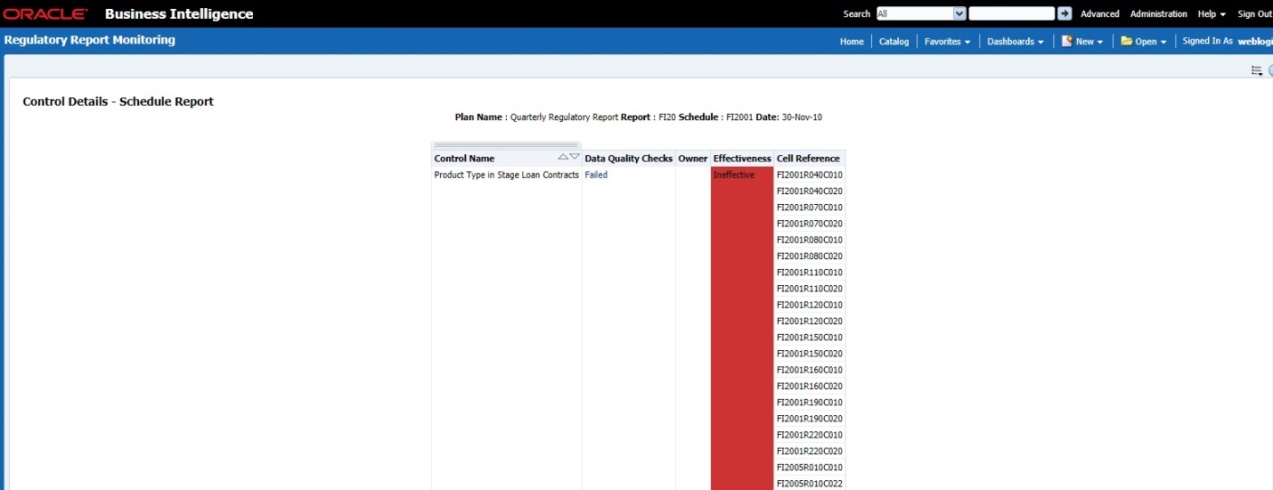
The following details appear in Issue Details - Controls:
— Issue Name
— Control Name
— Cell Reference
— Issue Owner
— Target Completion Date
— Issue Status
— Action Name
— Action Status
— Action Owner
— Create Action
Figure 145: Issue Details Controls
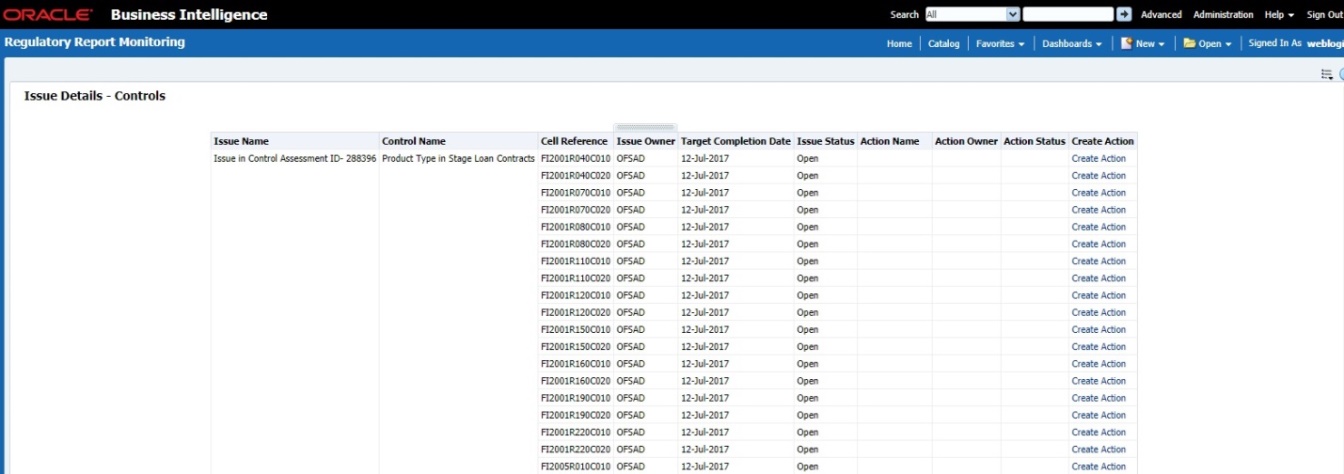
7. Click Data Quality Checks associated with each Control to display the following Data Quality Details:
— ID
— DQ Check
— Type
— Result
— Entity
— Attribute
Figure 146: Data Quality Checks

Click the Create a New Issue hyperlink to navigate to the OFSAA Create Issue page where the user can log a new issue.
Figure 147: Create a New Issue
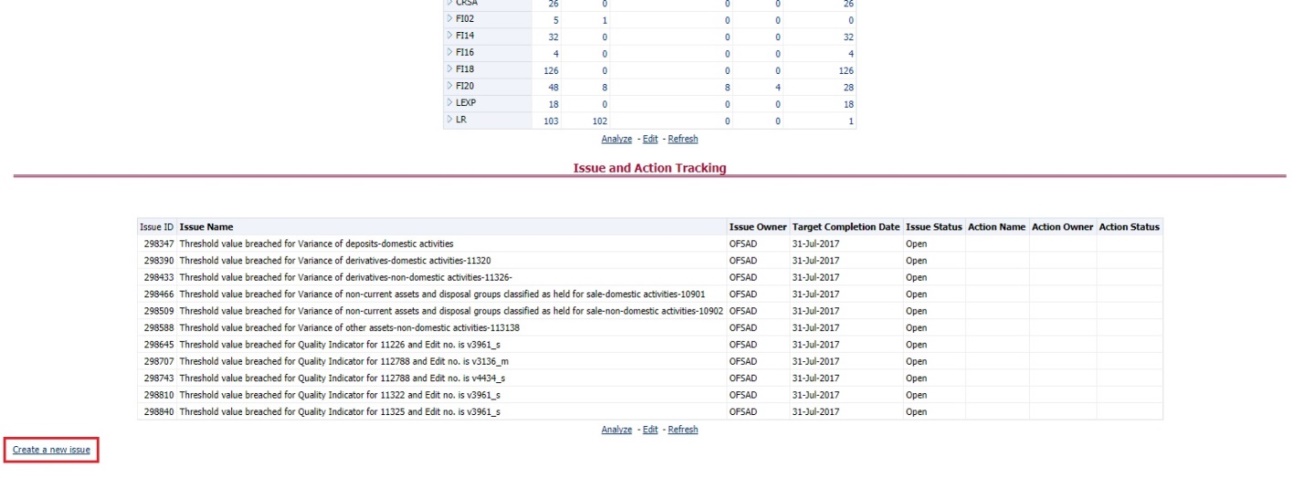
Click Create Action hyperlink to navigate to the OFSAA Create Action page where the user can create an action.
Figure 148: Create Action
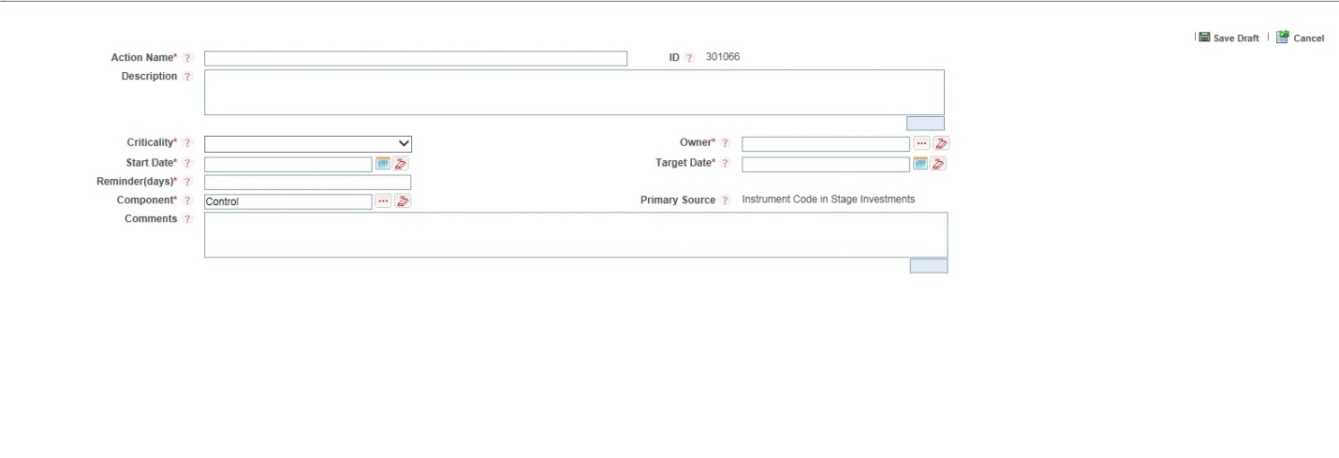
This report enables users to validate the regulatory reporting of cell values by SOR Data.
Figure 149: Data Origin Analysis
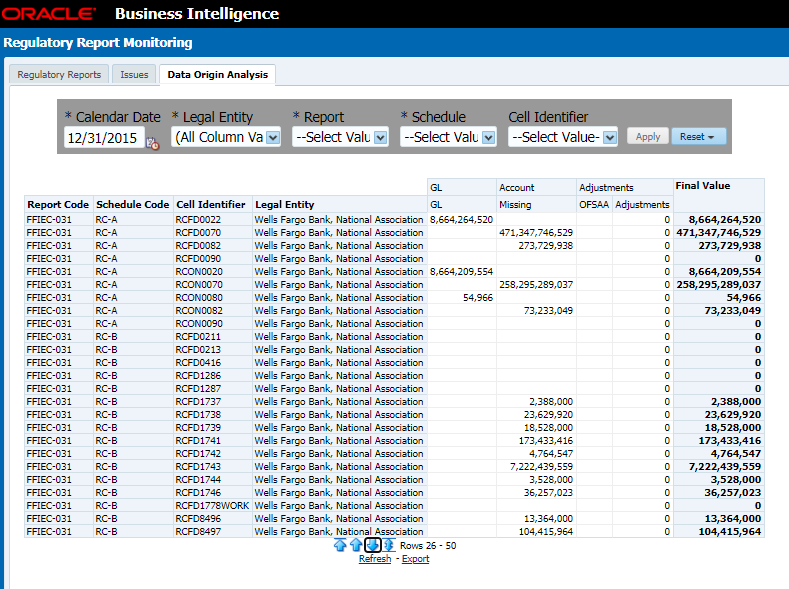
Variance analysis the process of identifying the causes of variations in the MDRM values between current and prior periods. It helps understand why fluctuations happen and what can or must be done to reduce the adverse variance. This eventually helps in finalizing the report cell (MDRM) values.
Variance analysis helps users identify threshold breaches set at the Report/Cell level before generating the final numbers. Based on the breached cell values, you can decide the course of action by either rectifying it using Cell level adjustment or take no action. This enables you to confidently submit the final numbers to the regulators.
Prerequisites
1. The Indicator assessment must be performed before verifying the variance analysis dashboard. Execute the batch DGS_KI_BATCH for the date on which the data needs to be analyzed. See the KI assessment section for more details.
2. Execute the account granularity batch ACCT_MAPPER_INSERT for generating Accounts, Accounts Writeoff, and Accounts Recovery. For more details on the parameter to be passed for generating the account level granularity, refer to the section Populating Data for Account Drill down Granularity (Variance Analysis dashboard).
3. Execute the Account and Party granularity batch ACCT_MAPPER_INSERT for generating the account and party. The account and party granularity are for the report ARF7200A. For more details on the parameter to be passed for generating the account and party level granularity, refer to the section Populating Data for Account Drill down Granularity (Variance Analysis dashboard).
Perform the following steps for the Variance Analysis dashboard before verifying the dashboard. After selecting Financial Services Data Governance for the preferred jurisdiction, navigate to Applications.
NOTE:
Note the following:
· Account and Party granularity generation are only for the report (ARF7200A).
· Variance analysis drill-down feature is not enabled for the cells which are count-based.
1. Navigate to Common Tasks > Operations > Batch Maintenance.
2. Select the required batch. See the APME (APRA/MAS/RBI) Run Chart MOS for more details.
NOTE:
· The batch ACCT_MAPPER_INSERT is used to load data from inter-mediatory tables of Account drill down with the matching Account number.
· The data must be available in the fct_gl_data for the Repline granularity. The data must be moved to the fct_gl_data by executing the T2T as a part of the FSDFF run.
The Variance Analysis Dashboard provides data based on selecting the values from the following list of dropdowns:
· Report: Based on the KI configuration this drop-down is populated. Select a pre-configured report.
· Schedule: Based on the KI configuration this drop-down is populated. Select a schedule.
· Cell Identifier: Based on the KI configuration this drop-down is populated. Select a cell identifier.
· Entity Name: Select an entity name.
· *Current Date: Select a date on which the assessment has been done.
· Variance %: Select a variance %
· Variance Amount Between: Enter the Variance Amount range.
· Breached: Select 'Yes' or 'No' or both.
NOTE:
Ensure you have configured the Key Indicators. Refer to the Configure Key Indicators section.
1. Click Apply to generate the reports.
2. Click Reset to reset the values. The generated report contains the following details:
§ Report Code: Provides report code of the cell.
§ Schedule Code: Provides schedule code of the cell.
§ Key indicatorCell Identifier: Provides the MDRM code of the cell.
§ Cell Line Item: Provides line item of the cell.
§ Cell Description: Provides the description of the code.
§ Entity: The entity for which the assessment was done.
§ Current Value: Provides the current value of the assessment.
§ Previous Value: Provides the previous value of the assessment.
§ Variance: Provides the difference between the current and previous values.
§ Variance %: Provides the percentage value of the variance.
Figure 150: Variance Analysis Dashboard
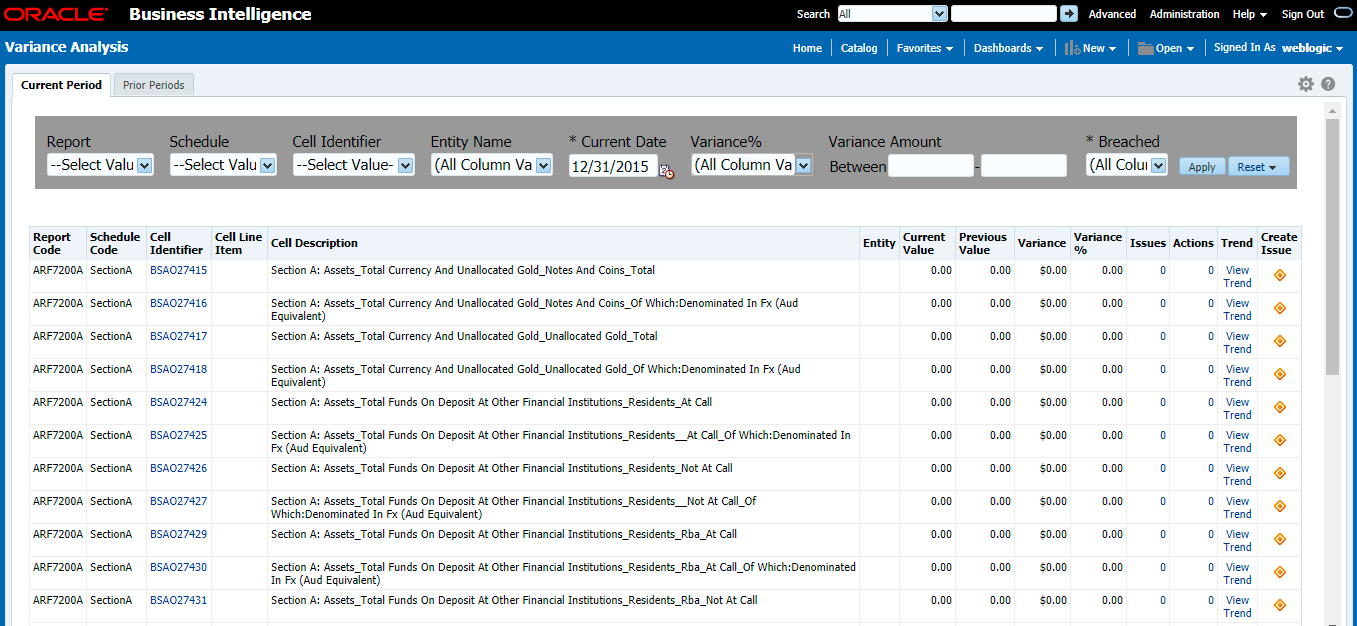
§ Issues: Provides the count of issues against each cell. There is a drill-down that displays the details of the issues.
Figure 151: Variance Analysis - Issue Details

§ Actions: Provides the actions taken for each issue. The drill-down shows the action count.
Figure 152: Variance Analysis - Action Details
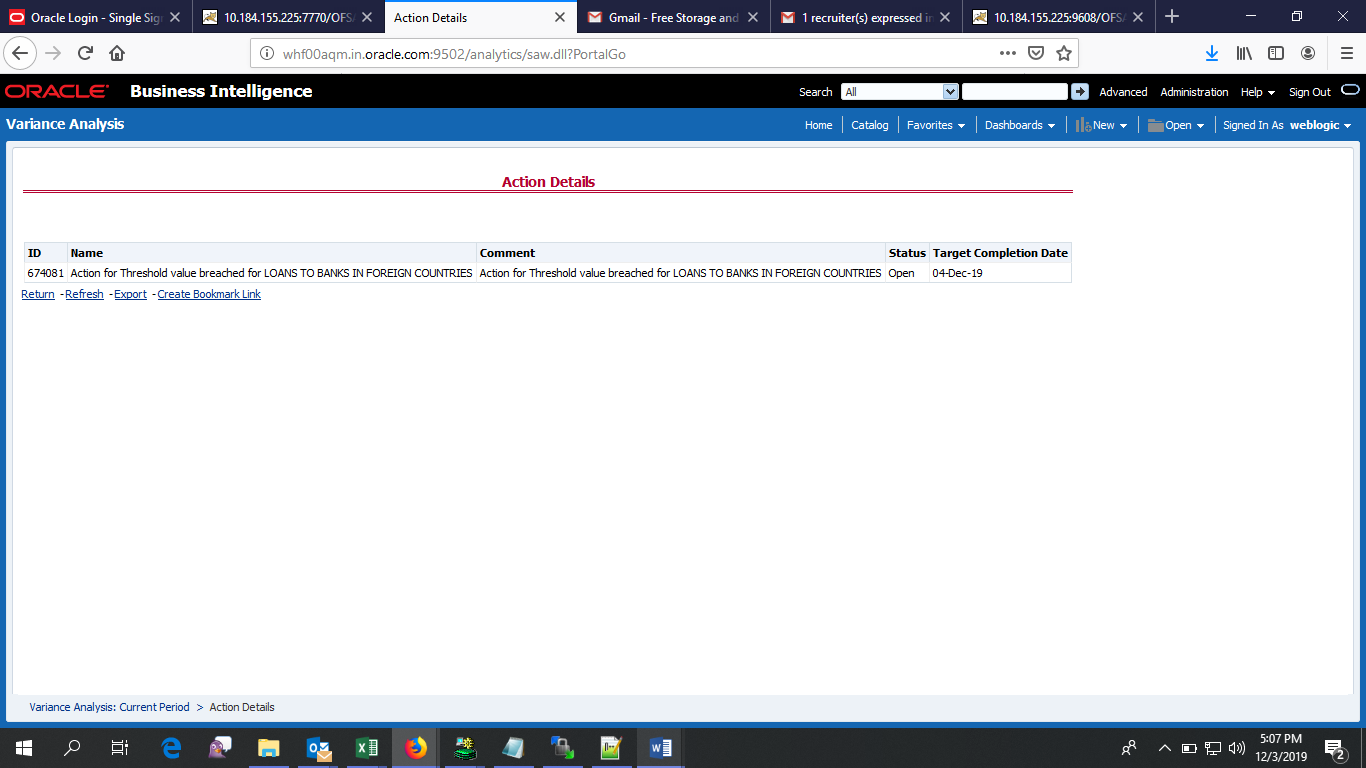
§ Trend: Displays the graphical representation of the assessment across time. You can select between:
— Trend for All Dates
— Trend for Date Range
NOTE:
Trend graphs can be exported to PDF and Excel.
Figure 153: Trend
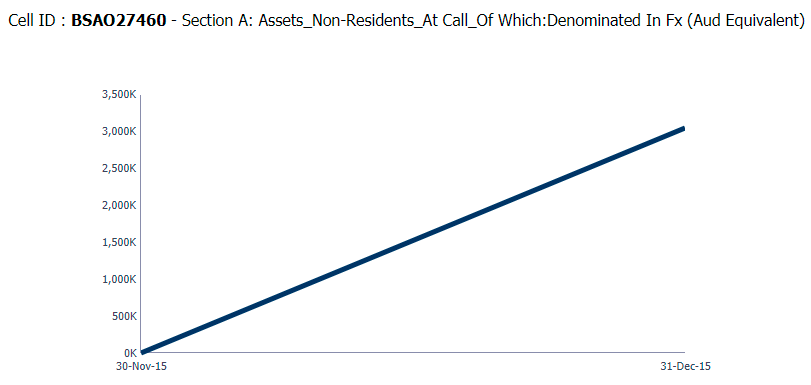
§ Create Issue: Create an issue from the dashboard itself against any cell irrespective of whether it has been breached or not. This issue can be modified on the DG Issues page. After you create an issue through this method, you can view the number of created issues in the OBI dashboard.
NOTE:
Before you create an issue, ensure that you have launched the DG application.
To create an issue through the Dashboards Page, perform the following steps:
a. In the Create Issue column, click the icon.
b. In the Issue Details page, enter values in the Name and Comments field.
c. Click Save Draft.
d. In the Cell Identifier column, select the link.
You can view the following information:
— Account Details: Provides the Account details along with the cell ID.
— The current and previous period values for the source data, adjustment, and final cell value. The data in the final cell is a combination of the source and adjustment data.
Figure 154: Account Details
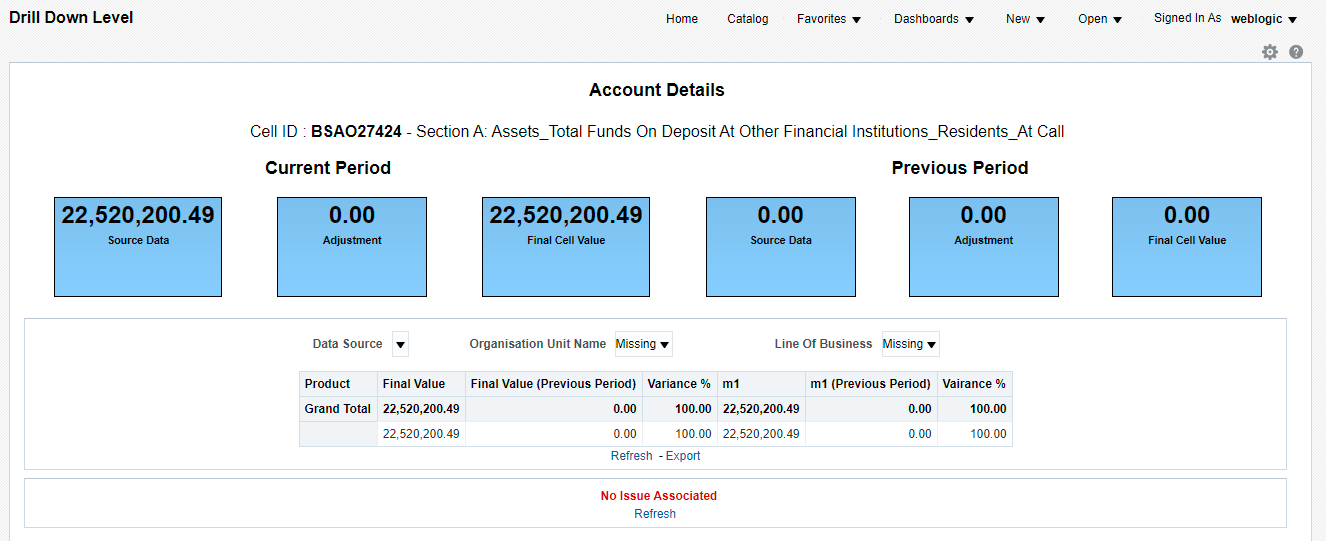
NOTE:
Measure the value displayed at the product level is the variance amount.
The Final Value and Final Value (Previous Period) to the Intermediate and Account drill-down templates are displayed. The values from these cells tie back to the current and previous values in the tile. The column totals defined at each level ties back to the previous level.
The following dimensions are supported in the variance analysis drill-down:
· Account Name
· Account Country Name
· Currency Name
· Data Source
· Issuer Name
· Entity Name
· Line of Business
· Organization Unit Name
· Party Name
· Product
· Product Type
· Region Description
· Regulatory Instrument Classification
· Regulatory Party Name
· Regulatory Product Classification