Creating Report Instances and Layouts
Each Excel spreadsheet created with PS/nVision is a report instance or a report layout. A report instance contains data that PS/nVision has retrieved from your PeopleSoft database. Every report instance is based on a report layout. PS/nVision uses the specified layout to determine the data to retrieve for the report and how to display it.
Note: Beginning from PeopleTools release 8.51, all PS/nVision layouts and all report instances (that are used to perform drilldown) must be in OpenXML (.xlsx) format. If you want to use existing layouts and reports that are in Excel 2003 (.xls) format, you must convert their format to .xlsx.
See Converting Existing Layouts and Reports to OpenXML Format.
Creating a PS/nVision report is a three-step process:
Define a report layout that specifies the ledgers, criteria, or queries to use for the report and how to format the report.
The report layout is an Excel spreadsheet that does not include actual PeopleSoft data; it defines the structure of the report—query information, criteria, text, formulas, graphics, formatting, or other information. After a layout has been saved, you can use it repeatedly to run reports.
Create a report request, specifying the layout and runtime options for the report.
Run the report request, using the nVision menu in Microsoft Excel, the Run button on the request dialog box, or a button/macro that calls PS/nVision to run the report.
As the report runs, a copy of the layout—an instance—is populated with data and is saved as a normal spreadsheet file. You can produce multiple instances of the report. For example, you might provide an inventory report for each location within your organization. Each instance is an individual report with current data from your database, selected and formatted according to the instructions in the report layout.
Note: If you are using a scope with your report, you can produce several instances from one layout with one report request.
Most PeopleSoft applications deliver predefined PS/nVision report layouts (such as Salaries by Department, Balance Sheet, Profit and Loss, and Operations Summary). Like any spreadsheet, a layout spreadsheet can be cloned and modified; you may rarely need to build one from scratch.
Besides the features that are available through PS/nVision, you can use Excel features to personalize layouts (and the resulting reports). For example, Excel includes dynamically linked charting and drawing tools for creating colorful graphs and diagrams. Because the layout is the basis for all reports produced from it, you can format and enhance the report once and get the benefits automatically each time the report is run.
Note: If you’re working with PeopleSoft Financials products, you may be interested in using ledgers with PS/nVision and taking advantage of the TimeSpan feature to define reports that roll from period to period without any changes to the layout. Using TimeSpans, you can have the same layout retrieve year-to-date data based on the as of date for which the report is requested.
See Understanding Ledger-Based Matrix Layouts, Defining Ledger Criteria, Understanding Report Scopes, Defining Scopes.
To help you visualize the relationship between a report layout and a report instance, this section includes a sample matrix layout with unique data selection criteria for individual rows and columns.
Image: A Sample layout having the Department, Description, Sales, and Costs fields
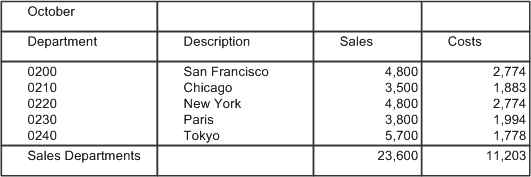
The following layout is an example of a report based on the layout. The Sales and Costs columns specify account numbers, and the rows specify department numbers.
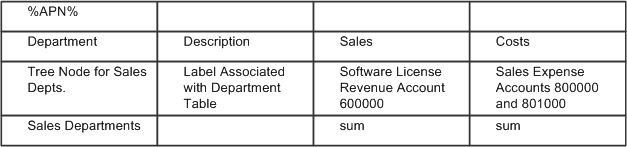
Image: A sample final report having the Department, Description, Sales, and Costs fields
In the final report, each cell contains the data for the account number (column) and department number (row) that intersect at that cell.
The sample layout contains several types of information:
Text
This refers to text that appears as-is in all report instances. In the sample above, the column headings—Department, Description, and so on—are standard text that remains the same in all reports created from the layout.
PS/nVision variables
PS/nVision replaces variables with values when you run a report. The sample layout uses the %APN% variable for the time period reported on. When PS/nVision creates a report with this layout, it replaces the variable with the period covered by the report. If you use a scope to produce multiple instances of a report, you can use variables in the report heading so each reader knows what data the report contains.
PS/nVision labels
PS/nVision examines the tree structure and determines where to obtain the appropriate label for either a tree node or a detail value. In the example, PS/nVision relates a sales department description to the department table entry for each department corresponding to the Sales Depts tree node.
PS/nVision selection criteria
Selection criteria specify the data to retrieve from your PeopleSoft database. For example, the Sales column in the sample layout has criteria that direct PS/nVision to retrieve data from the Sales account.
Microsoft Excel formulas
These formulas perform calculations on the report data. In the example, the bottom row automatically displays totals of the Sales and Costs columns. You could add a calculated column, Gross Income, calculated via an Excel formula that subtracted Costs from Sales.
Formatting
Formatting information includes attributes such as font size, underlining, column width, print options, and so on. You design your layouts using familiar Excel methods; any formatting and enhancements you place in the layout appear in all reports created from it.