Accessing the PeopleCode Debugger
Note: You can start a debugging session either before or after you start a PeopleSoft component.
Determine whether to run Application Designer in two-tier mode or three-tier mode.
If you are debugging Application Engine or component interface PeopleCode, run Application Designer in two-tier mode, with a direct connection to the database.
If you are debugging an application in PeopleSoft Pure Internet Architecture (PIA), run Application Designer in three-tier mode, through the application server. You must be logged on to PIA and to Application Designer using the same user ID.
Access the debugger through Application Designer by selecting Debug, PeopleCode Debugger Mode.
The Local Variables watch pane and the Call Stack pane open. PeopleCode programs that had breakpoints set from your previous debugging session are opened also, and the breakpoints are restored.
If you did not have breakpoints set, open the PeopleCode program you want to debug and enter debug mode. The debugger will open with the current PeopleCode program and you can set your breakpoints.
Note: If you have already opened the debugger and then closed it, the menu may not change correctly to enable you to access the debugger a second time. If this occurs, click the Local Variables window, and then try the Debug menu again.
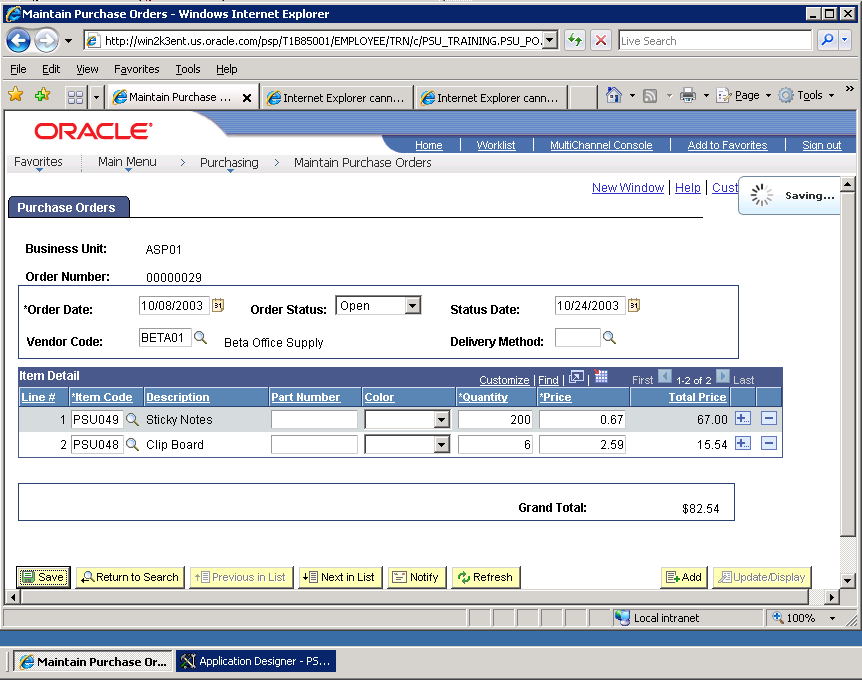
In PIA, navigate to the point where the breakpoint occurs. Your application pauses and the Application Designer icon flashes in the task bar. Switch to Application Designer to step through your program or continue running it.
Image: Application Designer icon flashes in the toolbar when the application hits a breakpoint
This example illustrates the fields and controls on the Application Designer icon flashes in the toolbar when the application hits a breakpoint. You can find definitions for the fields and controls later on this page.

If the debugger does not engage, check that you used the same user ID to log into PIA and Application Designer, then check your application server configuration to verify that PeopleCode debugger is enabled.
Note: Your security administrator has options for allowing users to access different parts of Application Designer, including the PeopleCode debugger. If you are having problems accessing the debugger, you may need to contact your system administrator about your security access. You can access the PeopleCode debugger from outside a firewall.