Modifying System Definitions
Access the System Definitions page (PeopleTools, Performance Monitor, Administration, System Definitions).
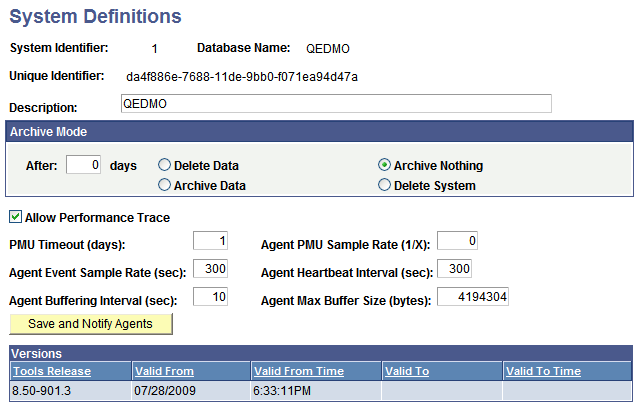
Image: System Definitions page
This example illustrates the fields and controls on the System Definitions page. You can find definitions for the fields and controls later on this page.
A system refers to a particular monitored system. For example, you can monitor your PeopleSoft CRM system, PeopleSoft HCM system, and PeopleSoft Financials system. System definitions are created automatically when the first agent of a monitored system registers with the monitoring system. The database name and GUID (a PeopleSoft value used to uniquely identify a PeopleSoft system) are provided by the agent during its registration process.
This section describes the properties and configuration options for each monitored system.
|
Field or Control |
Definition |
|---|---|
| System Identifier |
Identifies each monitored system. PeopleSoft automatically generates this value incrementally. |
| Database Name |
The name of the PeopleSoft application database that is running on the monitored system. The monitoring system automatically inserts this value when it recognizes and creates a monitored system. |
| Unique Identifier |
Uniquely identifies a particular PeopleSoft system. PeopleSoft assigns a unique value, referred to as a GUID, to each PeopleSoft application installation. When an agent registers with the Performance Monitor, it provides this GUID. The first time the monitoring system receives information from a monitored system, it detects the GUID. For each new GUID that is detected, the monitoring system creates a new monitored system definition. Note: When copying databases, you should delete the GUID in the new (copied) database. If the new database is monitored by the same instance of the Performance Monitor that is monitoring the source database, the monitor assumes that the agents for both systems belong to the same system. This not only doubles the data that is being stored for a particular system, but also makes it unreliable. To resolve this, set the value of the GUID field in the PSOPTIONS table to <space> in the new database. The next time an application server connects to the database, the system generates a new, unique GUID. You insert the blank value in the PSOPTIONS table using the SQL tool at your site. Note: After cloning a database and before booting the web server and application server, you should set the PPMI and monitor URL to NONE in the cloned database. This will prevent the agents of the cloned database from reporting into the monitoring system that was used previously. To reset the URLs, update the URL field to NONE in the PSURLDEFN table where the URL_ID field is PPM_MONITOR or PPM_PPMI. |
| Description |
A description of the monitoring system to assist recognition. The default value is the database name. |
| Archive Mode |
The archive mode that you set specifies how the archive program (PSPM_ARCHIVE) should process the performance data that is stored in the monitoring database. The default value is set to archive nothing after zero days. The options are:
Note: If the Archive: Clear PMUs & Events option is enabled in the Global Administration page, the archive settings are ignored. See Schedule Archive section. |
| Allow Performance Trace |
Enables authorized users who are connected to this monitored system to launch the Performance Trace Console. By default, this option is enabled on a new monitored system unless you adjust the system defaults on the System Defaults page. |
| PMU Timeout |
Indicates the interval in which an open PMU is considered timed out. PMU timeouts are measured in days. The PMU Timeout value can't be set to zero. After the specified interval, the system assumes that a PMU that has not finished encountered an error and should no longer be considered open. The PeopleSoft Application Engine reaper program (PSPM_REAPER) moves timed out PMUs from the current PMU tables to the history PMU tables and sets the status to Reaper Timed Out. Note: When a PMU starts, the application server agents specify an override timeout that is equal to the Tuxedo service timeout of the domain. In such cases, the reaper program uses the override value instead of the PMU Timeout that is specified here. |
| Agent Event Sample Rate |
Specifies the rate (in seconds) that agents collect resource metrics, such as CPU usage. The default is 300 seconds (five minutes). To disable event sampling, set the value to zero. Note: Smaller sampling rate intervals will provide more frequent updates of machine and process resource utilization on your monitored systems. However, consider that by decreasing the sampling rate interval, you increase the volume of data that is sent to and stored in the performance database. This increases the overall impact of performance monitoring. |
| Agent Buffering Interval |
Specifies the rate (in seconds) at which an agent sends performance data to the monitoring system. This value can't be set to zero. A smaller interval decreases the delay between the time when the monitored system generates performance data and the time that it is displayed on the monitoring system. Larger intervals enable more efficient transmission of performance data across the network because the system can consolidate the data into packets. The larger the interval, the greater the Agent Max Buffer size should be set. The default is 10 seconds. |
| Agent PMU Sample Rate |
Enables you to reduce the amount of PMU data that is generated by monitoring just 1 of every N server trips. Sampling does not affect PMUs that are initiated in a performance trace. |
| Agent Heartbeat Interval |
This is the interval at which agents that do not have any performance data to report or that are in standby mode connect to the monitor servlet to be notified of any configuration changes. If agents post data to the monitoring system before this interval expires, they will be notified of any configuration changes and the timer will be reset. The lower the number, the greater the responsiveness of the agents to configuration changes, but the greater the network traffic. This value can't be set to zero. The default value is 300. |
| Agent Max Buffer Size |
Determines the maximum size of the buffer containing performance data. This enables you to cap the amount of data that is being stored by the agent on the monitored system and the amount of data that is sent across your network. If this limit is reached, the agent automatically discards new performance data until the current data has been posted to the monitor servlet. The agent posts an alarm to the monitoring if the buffer size threshold is exceeded. The default is 4194304 bytes (4 MB). The minimum must be 10240 bytes (10 KB). |
| Save and Notify Agents |
Notifies the monitor servlet of configuration changes made on this page. First, the system saves the changes to the database. Notification of the monitor servlets occurs through the PeopleSoft Integration Broker gateway. The monitor servlet notifies the agents of changes when the agents next communicate with the monitor. A delay occurs in publishing changes to the monitored systems. The maximum delay is the agent heartbeat interval. Note: The Integration Broker Gateway must be configured correctly; otherwise, you will see an error message indicating that the agents were not notified of system changes. |
| Versions PeopleToolsmonitoring version history |
Enables you to view a history of the PeopleTools versions that are installed on a monitored system. The Tools Release column reveals the version numbers. The Valid From columns indicate the date and time that an agent on a particular version first communicated with the monitoring system. The Valid To columns indicate the date and time that an agent on a particular version last communicated with the monitoring system. |