Using the System Performance Home Page
Access the System Performance page (PeopleTools, Performance Monitor, System Monitor, System Performance).
The System Performance page provides various health indices as well as a high-level view of the performance of your web servers, application servers, and Process Scheduler server domains. It acts as the "home page" for system performance.
Note: A Status field appears at the top of the page only if the monitoring system detects stale data, which is data that is older than the specified event sampling rate. For example, if your event sample rate is 300 seconds, and no events have been received from a specific domain in over five minutes, then that domain is considered stale. Stale data could indicate an outage on the monitored system or that the monitored system's agent filters are set to 01–Standby. If a domain has been shut down permanently and you don't want it to appear with a stale data warning, go to the Agent Definitions page and set its domain monitor to inactive.
Viewing Performance Indices
|
Field or Control |
Definition |
|---|---|
| User Sessions |
Displays the number of users who have signed onto the system within the last 12 hours and have not signed off. Shows all PMU 109s (User Session Began) that do not have an associated 108 PMU (User Session Ended). These PMUs are associated by the session ID (Context 1). The User Sessions value includes only users who have signed on in the last 12 hours and only those users that have signed on since the last time the web server agent sent an Event 901 (Agent Initialization). For details on individual users, click the Current User Sessions link. Note: If users do not click the Sign out link on a PeopleSoft page and instead close the browser or navigate to another site, then the system displays them as current users until the web-server time-out value is reached. |
| Tuxedo Request Queued |
Displays the number of requests queued on all application servers on the monitored system. The value is the sum of all the metric 5s (Total pq) for Event 300s (Host Resource Status) that are sent by all active agents for the current system that are domain monitor agents of type application server. The value includes all Event 300 data that is generated within the defined sampling interval. |
| PMUs in Past Hour |
Displays the number of PMUs that have run in the past hour. This is an indication of the load on the monitored system, the level of monitoring, and whether the monitored system agents are currently communicating with the monitor. The value is the sum of the rows that are inserted into the PSPMTRANSHIST table within the last hour. For more details, click the Open PMUs and theCompleted PMUs link. |
| Alarms in Past Hour |
Displays the number of error and warning events that were posted by the monitored system's active agents in the past hour. This is the count of all events with filter levels of error and warning inserted into the PSPMEVENTHIST table in the last hour. For more details, click the Alarm History link. |
| Batch Jobs in Process |
Displays the number of Process Scheduler jobs that are currently running on all the Process Scheduler servers belonging to that monitored system. The value is the sum of all metric 1s for Event 350 (Master Scheduler Status). For more details, click the Master Scheduler link. Note: If a Master Scheduler is not configured for the monitored system, this value is zero. |
| Batch Jobs in Queue |
Displays the number of Process Scheduler jobs that are currently waiting to be assigned by the Master Scheduler. The value is the sum of all metric 2s for Event 350 (Master Scheduler Status). Note: If a Master Scheduler is not configured for the monitored system, this value is zero. |
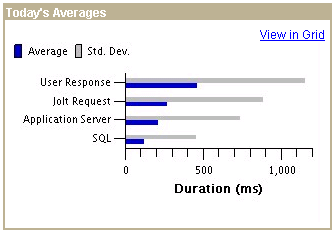
Today's Averages
The Today's Averages chart displays the average duration of various performance factors within your PeopleSoft system. The data applies only to the current day, which refers to all data that has been collected since midnight.
If progress slows in the system anywhere, this chart enables you to identify which tier is affected and enables you to monitor Tuxedo queueing.
Image: Today's Averages chart
This example illustrates the fields and controls on the Today's Averages chart. You can find definitions for the fields and controls later on this page.
|
Field or Control |
Definition |
|---|---|
| User Response |
Displays the average amount of time that end users waited for server round trips to finish. A user is waiting for a server round trip to finish when Processing appears in the upper, right-hand corner of a PeopleSoft page. Note: This average does not include network latency. It is the average duration of all top-level PMU 101s (PIA Request) that the monitoring system has received since midnight. |
| Jolt Request |
Displays the average and standard deviation of all PMU 115s (Jolt Request) received since midnight. |
| Application Server |
Displays the average and standard deviation of the duration of all PMU 400s (Tuxedo Service PeopleCode and SQL Summary) received since midnight. |
| SQL |
Displays the average and standard deviation for the time spent running SQL statements that were initiated from PeopleCode in a single application server request. This value includes the time that was required for SQL Prepare, Execute, Fetch, and Commit. PeopleCode SQL statements are run by application code that is written using PeopleCode and submitted to the database by way of SQLEXECs or SQL Objects. This value is derived from metrics 2, 3, and 4 from PMU 400 (Tuxedo Service PeopleCode and SQL Summary). Namely, this value includes PeopleCode SQL, PeopleCode Built-in SQL, and PeopleTools SQL. Note: This is the average time spent for running all SQL statements of these types in a single application server request. The system calculates this value using all data that has been received since midnight. |
Web Server Domains
The Web Server Domains grid contains a row for each active domain-monitor web-server agent. The metric information is derived from Event 150 (JVM status) and Event 151 (Network Status). The system retrieves only the most recent event for each agent. If the most recent event’s monitor date and time is older than the system’s event sample rate, the Stale Data icon appears in the grid row and at the top of the page.
Note: Web server agents do not report performance data until the first user connects to that web server.
|
Field or Control |
Definition |
|---|---|
| Name |
Displays the PeopleSoft web-server domain name that is being monitored. Click the name to go to the Web Server page for that web server. It's the same page that you access when you select and choose that domain. |
| Host/Port |
Identifies the web-server domain host name and listening port numbers for HTTP and HTTPS. |
| Filter Level |
Appears on pages displaying current performance information that is related to servers, such as application servers, web servers, and so on. Displays the current agent filter level. The colors indicate the following filter levels:
Move the cursor over the icon to show a pop-up message displaying the agent filter level in text format. |
| Sessions in Web App |
Displays the number of servlet sessions in the portal web application. |
| %JVM Memory Free |
A Java Virtual Machine (JVM) has a specific amount of memory allocated to it. This metric displays the percentage of the allocated memory that is available. |
| Execute Threads |
The number of threads that are used by the web application to service incoming requests. |
| Established Sockets |
The number of sockets in a connected state. This is a measure of the number of active users. |
| Jolt Traffic |
Displays the per second amount (in bytes) of Jolt traffic between the web server and the application server. |
Application Server Domains/Process Scheduler Server Domains
The application server and Process Scheduler Server grids contain a row for each active domain monitor agent that is running on the application server or Process Scheduler server. The metric information on each row is derived from Event 300 (Host Resource Status). The system retrieves only the most recent event for each agent. If the most recent event’s monitor date or time is older than the system’s event sample rate, the Stale Data icon appears in the grid row and at the top of the page.
Note: When first booted, an active server may have a stale data warning until a full sampling interval has passed.
|
Field or Control |
Definition |
|---|---|
| Domain Name |
Displays the names of the domains that are being monitored. Click the domain name to access the Application Server or the Process Scheduler page for additional details on a particular domain. It's the same page that you access when you select and choose that domain. |
| Host/Port |
Displays the server name or IP address and the Jolt listening port number. |
| Filter Level |
Appears on pages displaying current performance information that is related to servers, such as application servers, web servers, and so on. Displays the current agent filter level. The colors indicate the following levels:
Move the cursor over the icon to show a pop-up message displaying the agent filter level in text format. |
| %CPU Used |
Displays the percentage of the CPU capacity that is being used on the host. This percentage includes the entire processing load on the host, not just that of PeopleSoft. |
| %Memory Used |
Displays the percentage of committed memory used on the host. This percentage includes all memory used on the host and not just the memory used by PeopleSoft. |
| Hard Page Faults/Second |
This is the number of accesses to virtual memory in the last second that require disk reads on the host. This metric applies to all memory access on the host, not just the memory that is accessed by PeopleSoft. |
| Total Tuxedo Connections |
This is the number of connections to this domain, and it is equivalent to the number of rows that are returned by the Tuxedo command pclt (tmadmin), excluding JSH and WSH connections. This value does not apply to Process Scheduler. |
| Total Tuxedo Requests Queued |
The number of Tuxedo requests that are queued on that domain. A high number indicates that insufficient server processes are configured, or that the load on the host machine is too high. This value does not apply to Process Scheduler. |
Ping Test
PeopleSoft Ping is a diagnostic feature that enables you to troubleshoot systemic performance issues. If you enter the ping URLs for the monitored systems in the URL catalog, you can launch the ping test from the monitoring system instead of having to sign on to the monitored system.
The following requirements must be in place:
Single sign-in must be configured between the monitored and monitoring system.
Current user ID must be a valid user ID in both the monitored and monitoring system.
Current user ID must have permission to access the PSPing page in the monitored system.
Any system that you intend to ping must have an entry in the URL catalog for the PSPing page. The URL must contain PTPERF_TEST for the URL to appear in the ping lists that are associated with the Performance Monitor. For example,
http://server_name/psp/ps[_newwin]/EMPLOYEE/PT_LOCAL/c/UTILITIES.PTPERF_TEST.GBLNote: In a self-monitoring system, you must append the text "_newwin" to the end of the site name on which you are running the ping test. The "_newwin" indicates to the PeopleSoft system that the content can run in a new window at the same time that content from a different component runs in the previous window.
|
Field or Control |
Definition |
|---|---|
| URL Identifier |
Select the URL of the system that you want toping. |
| Execute PSPing |
Click to launch the PeopleSoft Ping page at the URL appearing in the URL Identifier field. The page appears in a new window. If that system is monitored, when you run Ping the system reports the results that are displayed on the Ping page to the monitoring system in the form of Event 600s (PSPING). |
| View PSPing History |
Launches the Event History search page displaying all Event 600 (PSPING) data for the current day on the current system. Verify that you ping the appropriate system. PeopleSoft runs no internal verification to verify that the system you ping is the system which this page is monitoring. |