Understanding Monitoring of Search Framework and Elasticsearch
Beginning with PeopleTools 8.57, PeopleSoft Search Framework uses Kibana, an open source analytics and visualizations platform, to monitor and provide analysis on Search Framework and Elasticsearch. In PeopleTools 8.58.13 and later, Search Framework uses Elasticsearch 7.10 and Kibana 7.10 and enables application developers to monitor the PeopleSoft application data through the application indexes in Elasticsearch.
Kibana is a Web application and works with Elasticsearch. Kibana provides visual reports in the form of charts, tables, etc. based on queries that you set up on Elasticsearch indexes.
In the PeopleSoft implementation, Search Framework uses Kibana to provide data on system metrics and indexing metrics and PeopleSoft application data. It provides real-time data as well as historical data. In the context of search functionality, users need real-time data to understand how their system is performing and to track errors, if any, in indexing. Historical data provides an insight into the performance of the system over a period of time and in the context of indexing proves to be an useful tool to analyze indexing statistics.
This topic aims to provide you instructions and information on using Kibana only with respect to its implementation in PeopleSoft Search Framework. Therefore, some of the capabilities of Kibana may not be described in this topic. If you need more information on any of the capabilities of Kibana, you should refer to the Kibana Guide [7.10], which is available on www.elastic.co.
Kibana uses the following terminology:
|
Kibana Terminology |
Description |
|---|---|
|
Dashboard |
A collection of visualizations. You can arrange the visualizations within a dashboard and share a dashboard. |
|
Visualization |
A visualization is based on Elasticsearch queries on the Elasticsearch data. A visualization is in the form of charts, maps, tables, etc. |
|
Index pattern |
“It tells Kibana which Elasticsearch indices you want to explore. An index pattern can match the name of a single index, or include a wildcard (*) to match multiple indices.” Kibana Guide [7.10], Discover, Create an index pattern. |
|
Attribute |
An attribute in PeopleSoft Search Framework corresponds to a search field in Elasticsearch and Kibana. |
In Kibana, a dashboard is a collection of visualizations and searches. A visualization is based on Elasticsearch queries on the Elasticsearch data. These visualizations are in the forms of charts, maps, tables, etc. PeopleSoft Search Framework delivers three system-monitoring dashboards, and each of the dashboards display two or more visualizations. For a list of delivered dashboards and visualizations, see Delivered Dashboards and Visualizations.
In PeopleTools 8.58, Search Framework enables you to create your own visualizations for PeopleSoft application data. Search Framework does not deliver any dashboard or visualization on application data, but in future PeopleSoft applications will implement some. Based on your business requirements, you may build your own dashboards and create visualizations. Typically, an application developer creates the dashboards and visualizations in Kibana and imports them into PeopleSoft. These dashboards can be configured as a tile or as related information in a PeopleSoft application component. An end-user needs to add this tile to a home page. A dashboard configured as related information appears based on the users access to the component.
For instructions on creating visualizations, refer to Creating a Visualization for Application Data.
This topic discusses some of the common elements on the visualization. For more information on the other elements on the Kibana visualizations, refer to the Kibana Guide [7.10], which is available on www.elastic.co.
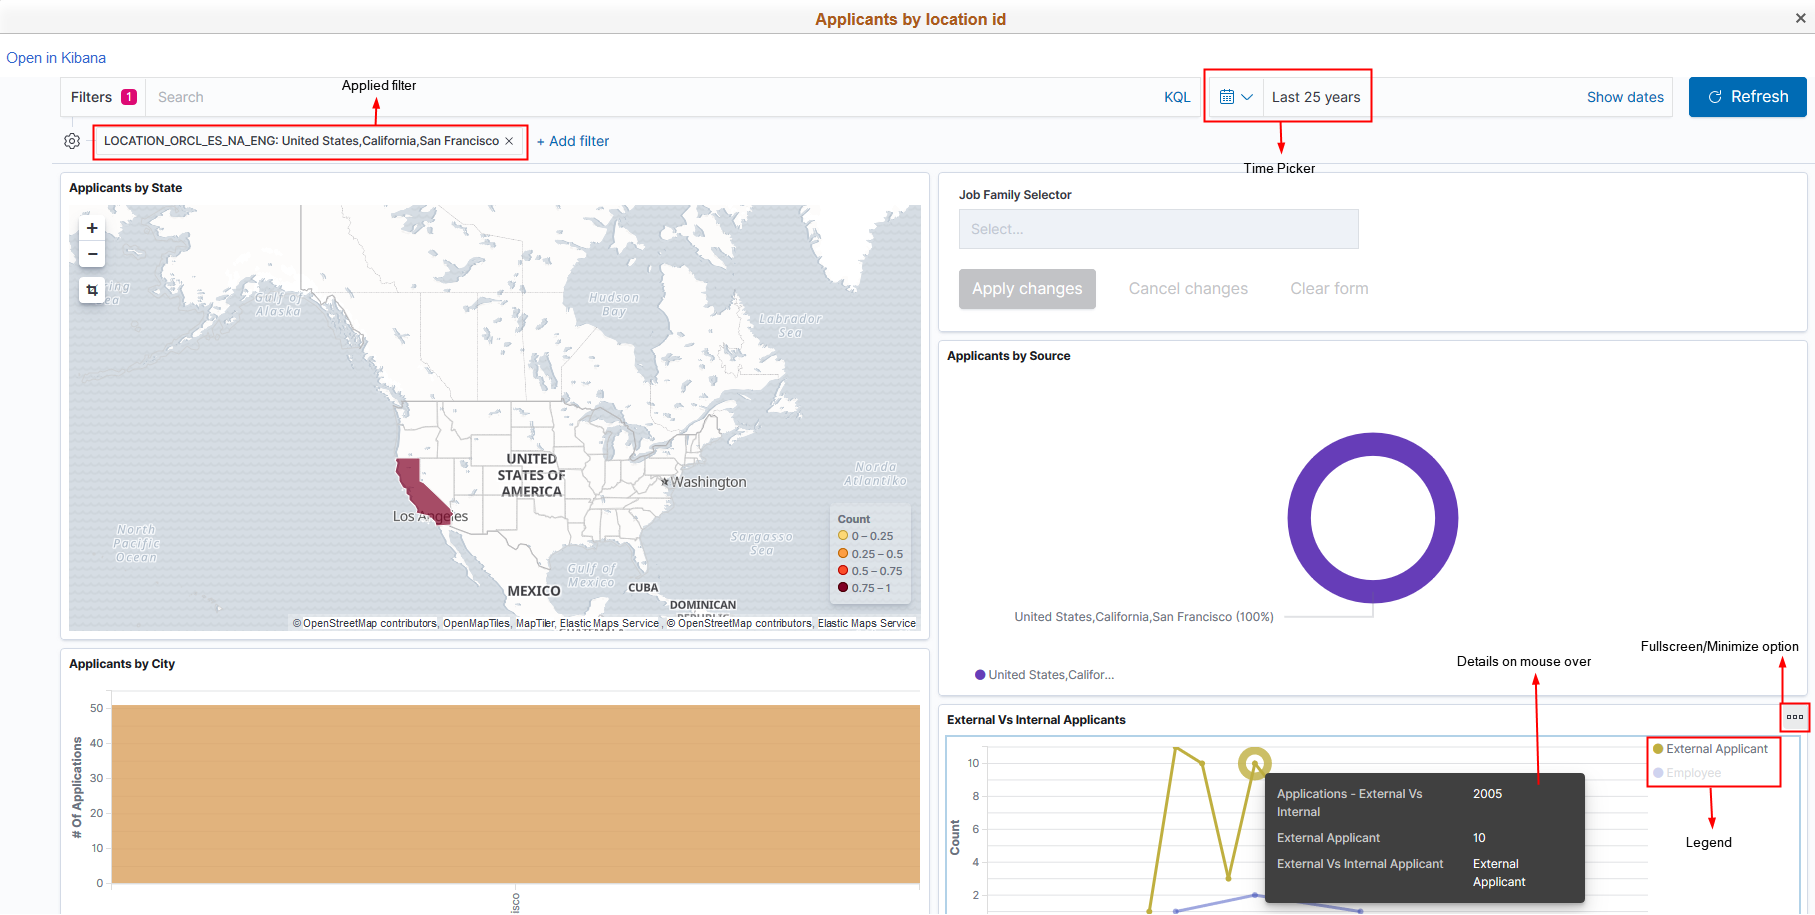
Image: Common Elements on Visualizations
This example illustrates the common elements on Visualizations. You can find definitions for these common elements later on this page.
|
Field or Control |
Definition |
|---|---|
| Applied Filter |
Use the filter option to filter data on the visualization. |
| Time Picker |
Use the Time Picker area to restrict the search results to a specific time period. The time picker enables you to set the filter to view real time data and historical data. For more information on time picker, refer to Kibana Guide [7.10], Discover, Set the time filter. |
| Fullscreen/Minimize Option |
Use the Fullscreen/Minimize Option button to enlarge the selected visualization. |
| Legend |
Kibana randomly uses different colors in a legend. You can collapse the legend if you want more real estate on the selected visualization. |
| Details on mouse over |
Hover the mouse over a chart to view details. |