Configuring a Series
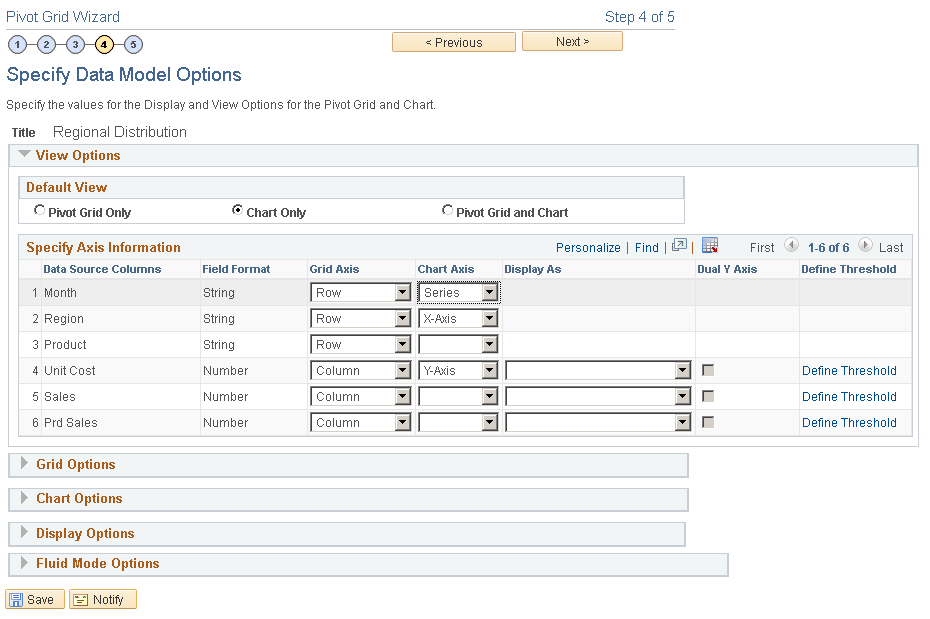
You can select Series in the Chart Axis column for any Data Source Columns. The data source column should have Axis dimension assigned to it.
You can display a series only on chart view, which means the pivot grid can only have a display of Chart or Pivot Grid and Chart.
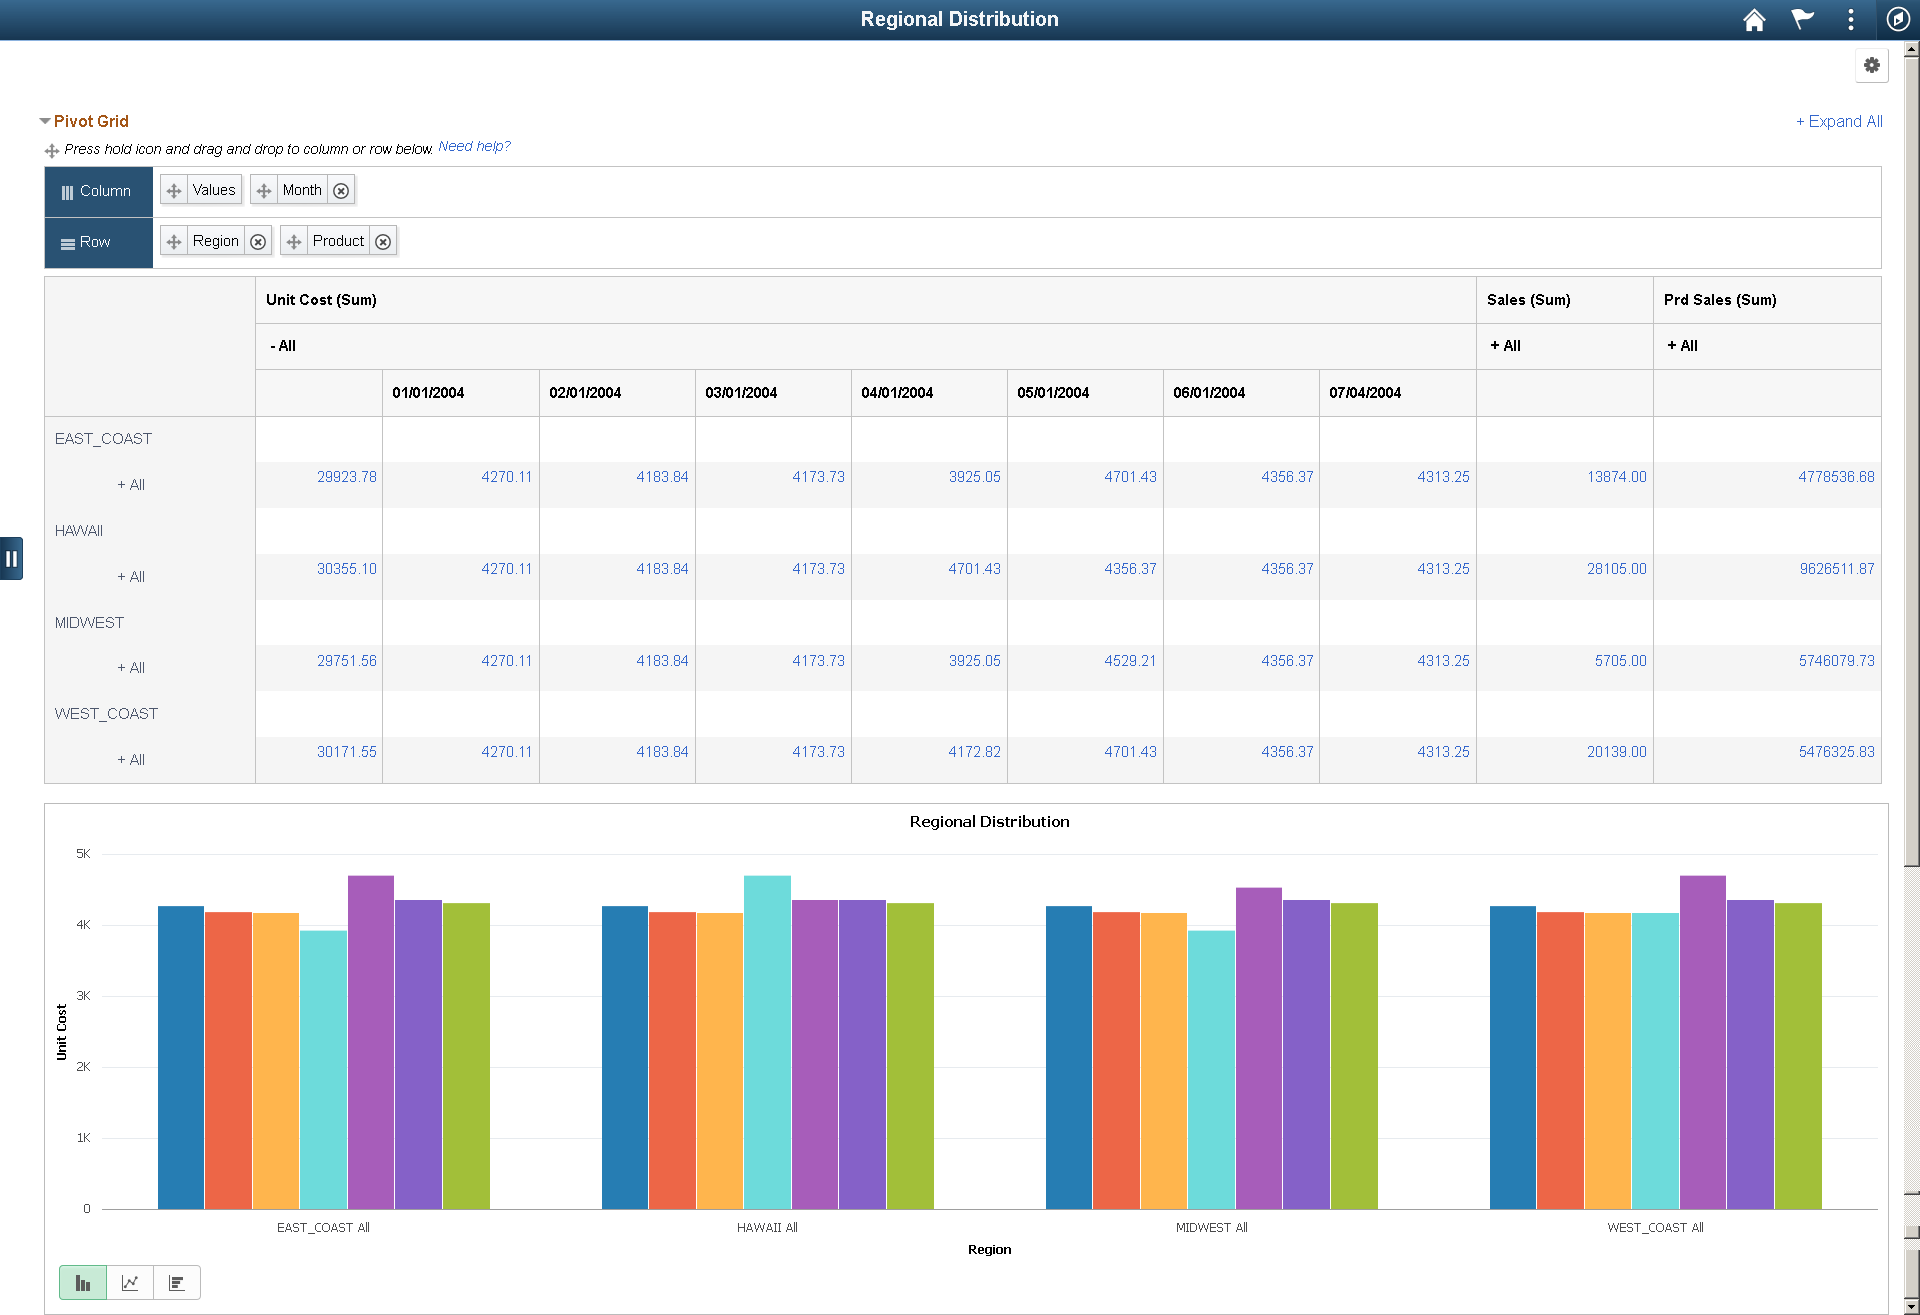
Image: Month as Series in Pivot Grid Model
In this example Month is defined as a Series. All the axes columns have All (Total) enabled. The total field is available on the Specify Data Model Values page.
In the Pivot Grid Viewer you can see the model with months as series.
Image: Chart displaying series
The chart shows Month as series.
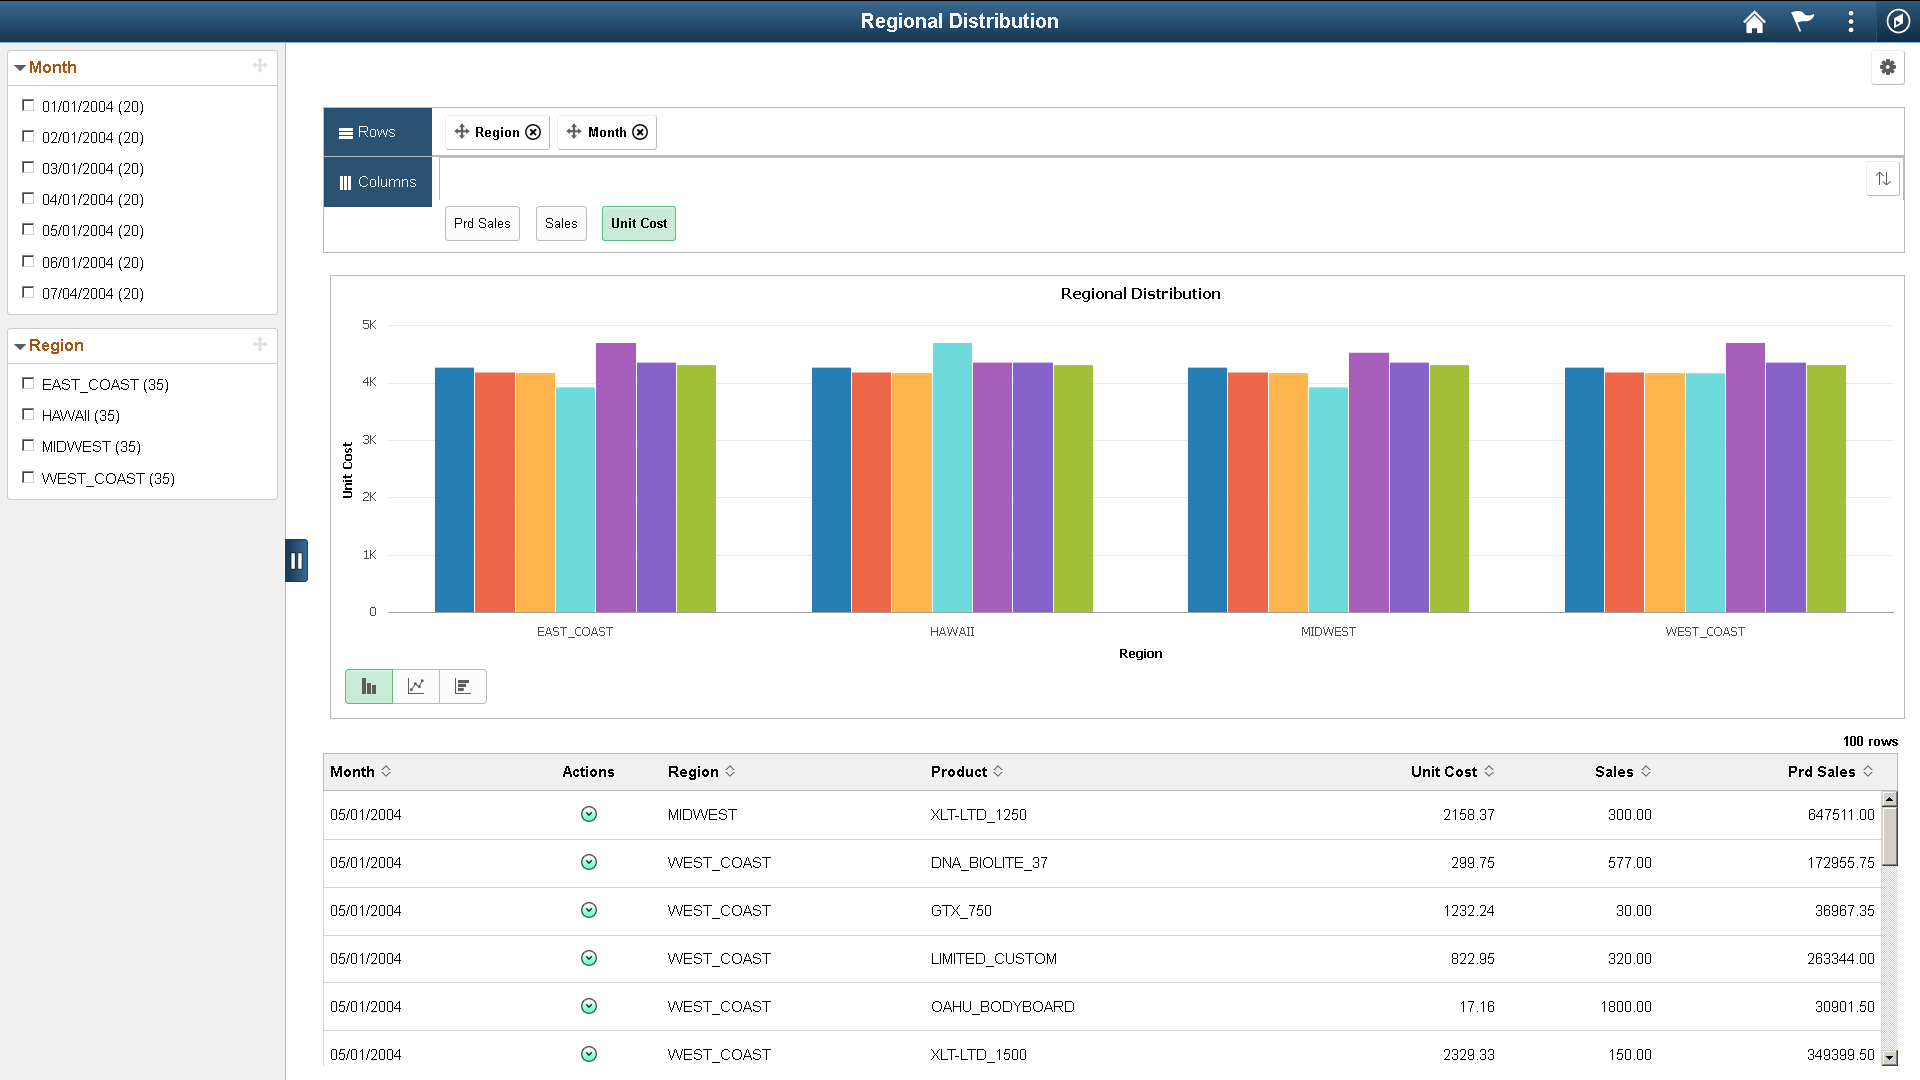
You can also drill down using the X axis. Right click and select Drilldown Intersection To. The option enables you to drill down to a datapoint in X axis, in this example you can drill down to product information for the selected month.
Image: Drilldown Intersection To
This example shows the chart with Products selected from the Drilldown Intersection To options.
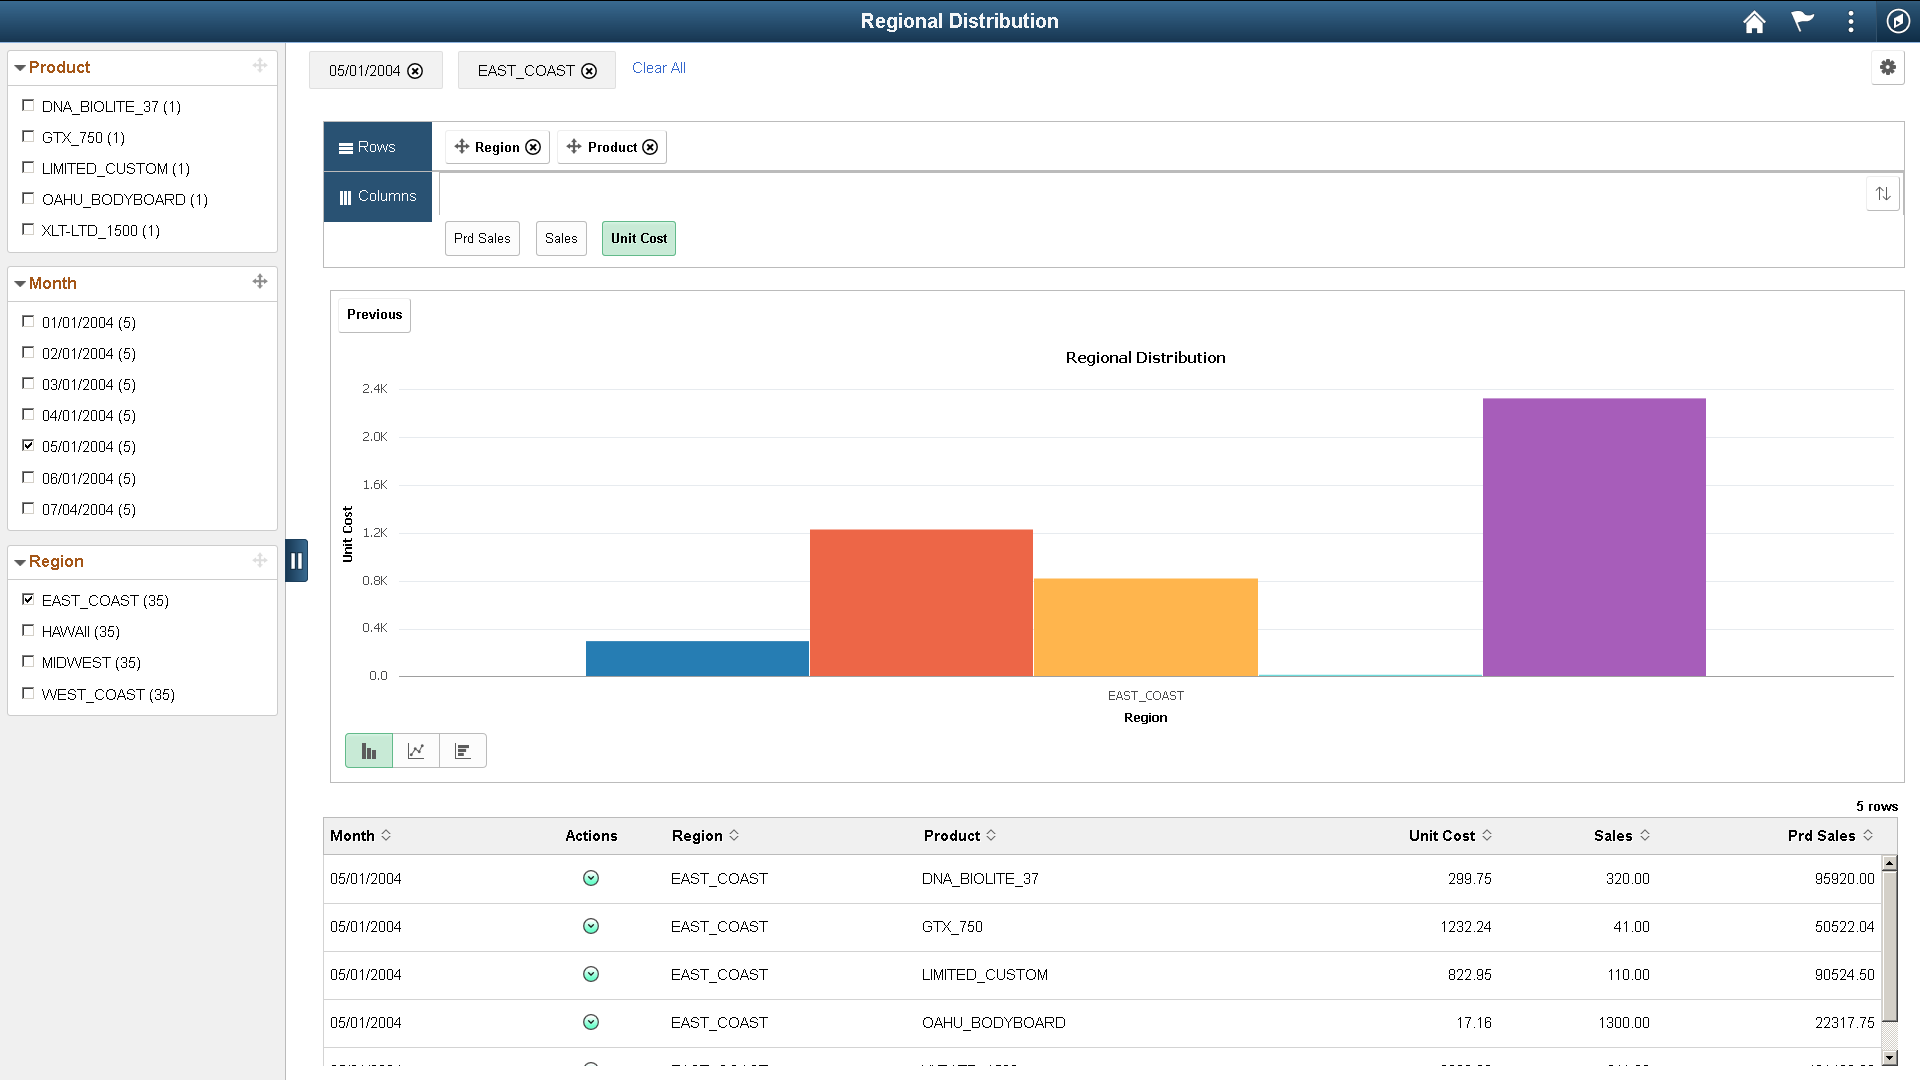
Image: Months displayed as a series on grid and chart
This example shows the grid and chart with detailed data based on the Month field.